


403
Sorry!!
Error! We're sorry, but the page you were looking for doesn't exist.
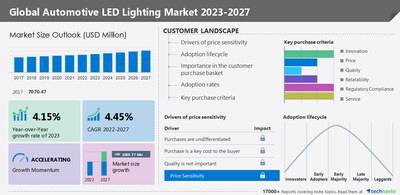
Global Automotive LED Lighting Market To Grow At YOY Of 4.15% Between 2022 And 2023, Insights On Post- Covid Analysis And Recovery-Technavio
| Automotive LED Lighting Market Scope | |
| Report Coverage | Details |
| Page number | 168 |
| Base year | 2022 |
| Historic period | 2017-2021 |
| Forecast period | 2023-2027 |
| Growth momentum & CAGR | Accelerate at a CAGR of 4.45% |
| Market growth 2023-2027 | USD 2,005.77 million |
| Market structure | Fragmented |
| YoY growth 2022-2023 | 4.15 |
| Regional analysis | APAC, Europe, North America, South America, and Middle East and Africa |
| Performing market contribution | APAC at 59% |
| Key countries | US, China, Japan, South Korea, and Germany |
| Competitive landscape | Leading vendors, market positioning of vendors, competitive strategies, and industry risks |
| Key companies profiled | Changzhou Xingyu Automotive Lighting System Co. Ltd., Everlight Electronics Co. Ltd., HELLA GmbH and Co. KGaA, Hyundai Mobis Co. Ltd, Koito Manufacturing Co. Ltd, Koninklijke Philips NV, LG Electronics Inc., Lumax Industries Ltd., Lumileds Holding BV, Marelli Holdings Co Ltd, Nichia Corp, OSRAM GmbH, Samsung Electronics Co. Ltd., Seoul Semiconductor Co. Ltd., SL Corp., Stanley Electric Co. Ltd., Tungsram Operations Kft., Valeo SA, Varroc Lighting, and Zumtobel Group AG |
| Market dynamics | Parent market analysis, market growth inducers and obstacles, fast-growing and slow-growing segment analysis, COVID-19 impact and recovery analysis and future consumer dynamics, and market condition analysis for the forecast period. |
| Customization purview | If our report has not included the data that you are looking for, you can reach out to our analysts and get segments customized. |
Browse for Technavio's consumer discretionary market
reports
Table of contents
1 Executive Summary
- 1.1 Market overview
- Exhibit 01: Executive Summary – Chart on Market Overview Exhibit 02: Executive Summary – Data Table on Market Overview Exhibit 03: Executive Summary – Chart on Global Market Characteristics Exhibit 04: Executive Summary – Chart on Market by Geography Exhibit 05: Executive Summary – Chart on Market Segmentation by Type Exhibit 06: Executive Summary – Chart on Market Segmentation by Application Exhibit 07: Executive Summary – Chart on Incremental Growth Exhibit 08: Executive Summary – Data Table on Incremental Growth Exhibit 09: Executive Summary – Chart on Vendor Market Positioning
2 Market Landscape
- 2.1 Market ecosystem
- Exhibit 10: Parent market Exhibit 11: Market Characteristics
3 Market Sizing
- 3.1 Market definition
- Exhibit 12: Offerings of vendors included in the market definition
- 3.2 Market segment analysis
- Exhibit 13: Market segments
- 3.3 Market size 2022
- 3.4 Market outlook: Forecast for 2022-2027
- Exhibit 14: Chart on Global - Market size and forecast 2022-2027 ($ million) Exhibit 15: Data Table on Global - Market size and forecast 2022-2027 ($ million) Exhibit 16: Chart on Global Market: Year-over-year growth 2022-2027 (%) Exhibit 17: Data Table on Global Market: Year-over-year growth 2022-2027 (%)
4 Historic Market Size
- 4.1 Global automotive LED lighting market 2017 - 2021
- Exhibit 18: Historic Market Size – Data Table on Global automotive LED lighting market 2017 - 2021 ($ million)
- 4.2 Type Segment Analysis 2017 - 2021
- Exhibit 19: Historic Market Size – Type Segment 2017 - 2021 ($ million)
- 4.3 Application Segment Analysis 2017 - 2021
- Exhibit 20: Historic Market Size – Application Segment 2017 - 2021 ($ million)
- 4.4 Geography Segment Analysis 2017 - 2021
- Exhibit 21: Historic Market Size – Geography Segment 2017 - 2021 ($ million)
- 4.5 Country Segment Analysis 2017 - 2021
- Exhibit 22: Historic Market Size – Country Segment 2017 - 2021 ($ million)
5 Five Forces Analysis
- 5.1 Five forces summary
- Exhibit 23: Five forces analysis - Comparison between 2022 and 2027
- 5.2 Bargaining power of buyers
- Exhibit 24: Chart on Bargaining power of buyers – Impact of key factors 2022 and 2027
- 5.3 Bargaining power of suppliers
- Exhibit 25: Bargaining power of suppliers – Impact of key factors in 2022 and 2027
- 5.4 Threat of new entrants
- Exhibit 26: Threat of new entrants – Impact of key factors in 2022 and 2027
- 5.5 Threat of substitutes
- Exhibit 27: Threat of substitutes – Impact of key factors in 2022 and 2027
- 5.6 Threat of rivalry
- Exhibit 28: Threat of rivalry – Impact of key factors in 2022 and 2027
- 5.7 Market condition
- Exhibit 29: Chart on Market condition - Five forces 2022 and 2027
6 Market Segmentation by Type
- 6.1 Market segments
- Exhibit 30: Chart on Type - Market share 2022-2027 (%) Exhibit 31: Data Table on Type - Market share 2022-2027 (%)
- 6.2 Comparison by Type
- Exhibit 32: Chart on Comparison by Type Exhibit 33: Data Table on Comparison by Type
- 6.3 Exterior - Market size and forecast 2022-2027
- Exhibit 34: Chart on Exterior - Market size and forecast 2022-2027 ($ million) Exhibit 35: Data Table on Exterior - Market size and forecast 2022-2027 ($ million) Exhibit 36: Chart on Exterior - Year-over-year growth 2022-2027 (%) Exhibit 37: Data Table on Exterior - Year-over-year growth 2022-2027 (%)
- 6.4 Interior - Market size and forecast 2022-2027
- Exhibit 38: Chart on Interior - Market size and forecast 2022-2027 ($ million) Exhibit 39: Data Table on Interior - Market size and forecast 2022-2027 ($ million) Exhibit 40: Chart on Interior - Year-over-year growth 2022-2027 (%) Exhibit 41: Data Table on Interior - Year-over-year growth 2022-2027 (%)
- 6.5 Market opportunity by Type
- Exhibit 42: Market opportunity by Type ($ million)
7 Market Segmentation by Application
- 7.1 Market segments
- Exhibit 43: Chart on Application - Market share 2022-2027 (%) Exhibit 44: Data Table on Application - Market share 2022-2027 (%)
- 7.2 Comparison by Application
- Exhibit 45: Chart on Comparison by Application Exhibit 46: Data Table on Comparison by Application
- 7.3 Passenger cars - Market size and forecast 2022-2027
- Exhibit 47: Chart on Passenger cars - Market size and forecast 2022-2027 ($ million) Exhibit 48: Data Table on Passenger cars - Market size and forecast 2022-2027 ($ million) Exhibit 49: Chart on Passenger cars - Year-over-year growth 2022-2027 (%) Exhibit 50: Data Table on Passenger cars - Year-over-year growth 2022-2027 (%)
- 7.4 Commercial vehicles - Market size and forecast 2022-2027
- Exhibit 51: Chart on Commercial vehicles - Market size and forecast 2022-2027 ($ million) Exhibit 52: Data Table on Commercial vehicles - Market size and forecast 2022-2027 ($ million) Exhibit 53: Chart on Commercial vehicles - Year-over-year growth 2022-2027 (%) Exhibit 54: Data Table on Commercial vehicles - Year-over-year growth 2022-2027 (%)
- 7.5 Market opportunity by Application
- Exhibit 55: Market opportunity by Application ($ million)
8 Customer Landscape
- 8.1 Customer landscape overview
- Exhibit 56: Analysis of price sensitivity, lifecycle, customer purchase basket, adoption rates, and purchase criteria
9 Geographic Landscape
- 9.1 Geographic segmentation
- Exhibit 57: Chart on Market share by geography 2022-2027 (%) Exhibit 58: Data Table on Market share by geography 2022-2027 (%)
- 9.2 Geographic comparison
- Exhibit 59: Chart on Geographic comparison Exhibit 60: Data Table on Geographic comparison
- 9.3 APAC - Market size and forecast 2022-2027
- Exhibit 61: Chart on APAC - Market size and forecast 2022-2027 ($ million) Exhibit 62: Data Table on APAC - Market size and forecast 2022-2027 ($ million) Exhibit 63: Chart on APAC - Year-over-year growth 2022-2027 (%) Exhibit 64: Data Table on APAC - Year-over-year growth 2022-2027 (%)
- 9.4 Europe - Market size and forecast 2022-2027
- Exhibit 65: Chart on Europe - Market size and forecast 2022-2027 ($ million) Exhibit 66: Data Table on Europe - Market size and forecast 2022-2027 ($ million) Exhibit 67: Chart on Europe - Year-over-year growth 2022-2027 (%) Exhibit 68: Data Table on Europe - Year-over-year growth 2022-2027 (%)
- 9.5 North America - Market size and forecast 2022-2027
- Exhibit 69: Chart on North America - Market size and forecast 2022-2027 ($ million) Exhibit 70: Data Table on North America - Market size and forecast 2022-2027 ($ million) Exhibit 71: Chart on North America - Year-over-year growth 2022-2027 (%) Exhibit 72: Data Table on North America - Year-over-year growth 2022-2027 (%)
- 9.6 South America - Market size and forecast 2022-2027
- Exhibit 73: Chart on South America - Market size and forecast 2022-2027 ($ million) Exhibit 74: Data Table on South America - Market size and forecast 2022-2027 ($ million) Exhibit 75: Chart on South America - Year-over-year growth 2022-2027 (%) Exhibit 76: Data Table on South America - Year-over-year growth 2022-2027 (%)
- 9.7 Middle East and Africa - Market size and forecast 2022-2027
- Exhibit 77: Chart on Middle East and Africa - Market size and forecast 2022-2027 ($ million) Exhibit 78: Data Table on Middle East and Africa - Market size and forecast 2022-2027 ($ million) Exhibit 79: Chart on Middle East and Africa - Year-over-year growth 2022-2027 (%) Exhibit 80: Data Table on Middle East and Africa - Year-over-year growth 2022-2027 (%)
- 9.8 China - Market size and forecast 2022-2027
- Exhibit 81: Chart on China - Market size and forecast 2022-2027 ($ million) Exhibit 82: Data Table on China - Market size and forecast 2022-2027 ($ million) Exhibit 83: Chart on China - Year-over-year growth 2022-2027 (%) Exhibit 84: Data Table on China - Year-over-year growth 2022-2027 (%)
- 9.9 US - Market size and forecast 2022-2027
- Exhibit 85: Chart on US - Market size and forecast 2022-2027 ($ million) Exhibit 86: Data Table on US - Market size and forecast 2022-2027 ($ million) Exhibit 87: Chart on US - Year-over-year growth 2022-2027 (%) Exhibit 88: Data Table on US - Year-over-year growth 2022-2027 (%)
- 9.10 Germany - Market size and forecast 2022-2027
- Exhibit 89: Chart on Germany - Market size and forecast 2022-2027 ($ million) Exhibit 90: Data Table on Germany - Market size and forecast 2022-2027 ($ million) Exhibit 91: Chart on Germany - Year-over-year growth 2022-2027 (%) Exhibit 92: Data Table on Germany - Year-over-year growth 2022-2027 (%)
- 9.11 Japan - Market size and forecast 2022-2027
- Exhibit 93: Chart on Japan - Market size and forecast 2022-2027 ($ million) Exhibit 94: Data Table on Japan - Market size and forecast 2022-2027 ($ million) Exhibit 95: Chart on Japan - Year-over-year growth 2022-2027 (%) Exhibit 96: Data Table on Japan - Year-over-year growth 2022-2027 (%)
- 9.12 South Korea - Market size and forecast 2022-2027
- Exhibit 97: Chart on South Korea - Market size and forecast 2022-2027 ($ million) Exhibit 98: Data Table on South Korea - Market size and forecast 2022-2027 ($ million) Exhibit 99: Chart on South Korea - Year-over-year growth 2022-2027 (%) Exhibit 100: Data Table on South Korea - Year-over-year growth 2022-2027 (%)
- 9.13 Market opportunity by geography
- Exhibit 101: Market opportunity by geography ($ million)
10 Drivers, Challenges, and Trends
- 10.1 Market drivers
- 10.2 Market challenges
- 10.3 Impact of drivers and challenges
- Exhibit 102: Impact of drivers and challenges in 2022 and 2027
- 10.4 Market trends
11 Vendor Landscape
- 11.1 Overview
- 11.2 Vendor landscape
- Exhibit 103: Overview on Criticality of inputs and Factors of differentiation
- 11.3 Landscape disruption
- Exhibit 104: Overview on factors of disruption
- 11.4 Industry risks
- Exhibit 105: Impact of key risks on business
12 Vendor Analysis
- 12.1 Vendors covered
- Exhibit 106: Vendors covered
- 12.2 Market positioning of vendors
- Exhibit 107: Matrix on vendor position and classification
- 12.3 Changzhou Xingyu Automotive Lighting System Co. Ltd.
- Exhibit 108: Changzhou Xingyu Automotive Lighting System Co. Ltd. - Overview Exhibit 109: Changzhou Xingyu Automotive Lighting System Co. Ltd. - Product / Service Exhibit 110: Changzhou Xingyu Automotive Lighting System Co. Ltd. - Key offerings
- 12.4 Everlight Electronics Co. Ltd.
- Exhibit 111: Everlight Electronics Co. Ltd. - Overview Exhibit 112: Everlight Electronics Co. Ltd. - Business segments Exhibit 113: Everlight Electronics Co. Ltd. - Key news Exhibit 114: Everlight Electronics Co. Ltd. - Key offerings Exhibit 115: Everlight Electronics Co. Ltd. - Segment focus
- 12.5 HELLA GmbH and Co. KGaA
- Exhibit 116: HELLA GmbH and Co. KGaA - Overview Exhibit 117: HELLA GmbH and Co. KGaA - Business segments Exhibit 118: HELLA GmbH and Co. KGaA - Key news Exhibit 119: HELLA GmbH and Co. KGaA - Key offerings Exhibit 120: HELLA GmbH and Co. KGaA - Segment focus
- 12.6 Hyundai Mobis Co. Ltd
- Exhibit 121: Hyundai Mobis Co. Ltd - Overview Exhibit 122: Hyundai Mobis Co. Ltd - Business segments Exhibit 123: Hyundai Mobis Co. Ltd - Key news Exhibit 124: Hyundai Mobis Co. Ltd - Key offerings Exhibit 125: Hyundai Mobis Co. Ltd - Segment focus
- 12.7 Koito Manufacturing Co. Ltd
- Exhibit 126: Koito Manufacturing Co. Ltd - Overview Exhibit 127: Koito Manufacturing Co. Ltd - Business segments Exhibit 128: Koito Manufacturing Co. Ltd - Key offerings Exhibit 129: Koito Manufacturing Co. Ltd - Segment focus
- 12.8 Koninklijke Philips NV
- Exhibit 130: Koninklijke Philips NV - Overview Exhibit 131: Koninklijke Philips NV - Business segments Exhibit 132: Koninklijke Philips NV - Key news Exhibit 133: Koninklijke Philips NV - Key offerings Exhibit 134: Koninklijke Philips NV - Segment focus
- 12.9 LG Electronics Inc.
- Exhibit 135: LG Electronics Inc. - Overview Exhibit 136: LG Electronics Inc. - Business segments Exhibit 137: LG Electronics Inc. - Key news Exhibit 138: LG Electronics Inc. - Key offerings Exhibit 139: LG Electronics Inc. - Segment focus
- 12.10 Lumax Industries Ltd.
- Exhibit 140: Lumax Industries Ltd. - Overview Exhibit 141: Lumax Industries Ltd. - Product / Service Exhibit 142: Lumax Industries Ltd. - Key offerings
- 12.11 Lumileds Holding BV
- Exhibit 143: Lumileds Holding BV - Overview Exhibit 144: Lumileds Holding BV - Product / Service Exhibit 145: Lumileds Holding BV - Key offerings
- 12.12 Marelli Holdings Co Ltd
- Exhibit 146: Marelli Holdings Co Ltd - Overview Exhibit 147: Marelli Holdings Co Ltd - Product / Service Exhibit 148: Marelli Holdings Co Ltd - Key news Exhibit 149: Marelli Holdings Co Ltd - Key offerings
- 12.13 OSRAM GmbH
- Exhibit 150: OSRAM GmbH - Overview Exhibit 151: OSRAM GmbH - Business segments Exhibit 152: OSRAM GmbH - Key offerings Exhibit 153: OSRAM GmbH - Segment focus
- 12.14 Samsung Electronics Co. Ltd.
- Exhibit 154: Samsung Electronics Co. Ltd. - Overview Exhibit 155: Samsung Electronics Co. Ltd. - Business segments Exhibit 156: Samsung Electronics Co. Ltd. - Key news Exhibit 157: Samsung Electronics Co. Ltd. - Key offerings Exhibit 158: Samsung Electronics Co. Ltd. - Segment focus
- 12.15 Stanley Electric Co. Ltd.
- Exhibit 159: Stanley Electric Co. Ltd. - Overview Exhibit 160: Stanley Electric Co. Ltd. - Business segments Exhibit 161: Stanley Electric Co. Ltd. - Key offerings Exhibit 162: Stanley Electric Co. Ltd. - Segment focus
- 12.16 Valeo SA
- Exhibit 163: Valeo SA - Overview Exhibit 164: Valeo SA - Business segments Exhibit 165: Valeo SA - Key offerings Exhibit 166: Valeo SA - Segment focus
- 12.17 Varroc Lighting
- Exhibit 167: Varroc Lighting - Overview Exhibit 168: Varroc Lighting - Product / Service Exhibit 169: Varroc Lighting - Key offerings
13 Appendix
- 13.1 Scope of the report
- 13.2 Inclusions and exclusions checklist
- Exhibit 170: Inclusions checklist Exhibit 171: Exclusions checklist
- 13.3 Currency conversion rates for US$
- Exhibit 172: Currency conversion rates for US$
- 13.4 Research methodology
- Exhibit 173: Research methodology Exhibit 174: Validation techniques employed for market sizing Exhibit 175: Information sources
- 13.5 List of abbreviations
- Exhibit 176: List of abbreviations
Technavio is a leading global technology research and advisory company. Their research and analysis focus on emerging market trends and provide actionable insights to help businesses identify market opportunities and develop effective strategies to optimize their market positions. With over 500 specialized analysts, Technavio's report library consists of more than 17,000 reports and counting, covering 800 technologies, spanning across 50 countries. Their client base consists of enterprises of all sizes, including more than 100 Fortune 500 companies. This growing client base relies on Technavio's comprehensive coverage, extensive research, and actionable market insights to identify opportunities in existing and potential markets and assess their competitive positions within changing market scenarios.
ContactTechnavio Research
Jesse Maida
Media & Marketing Executive
US: +1 844 364 1100
UK: +44 203 893 3200
Email: [email protected]
Website:
SOURCE Technavio

Legal Disclaimer:
MENAFN provides the
information “as is” without warranty of any kind. We do not accept
any responsibility or liability for the accuracy, content, images,
videos, licenses, completeness, legality, or reliability of the information
contained in this article. If you have any complaints or copyright
issues related to this article, kindly contact the provider above.
Most popular stories
Market Research

More Story


Comments
No comment