(MENAFN- ValueWalktest) After the weekend, crude oil prices moved away from their lowest in twelve months. The cold snap that boosts energy demand is taking precedence over concerns about global growth.
Table of Contents show
1.
supply and demand
2.
weather
3.
technical charts
Supply And Demand
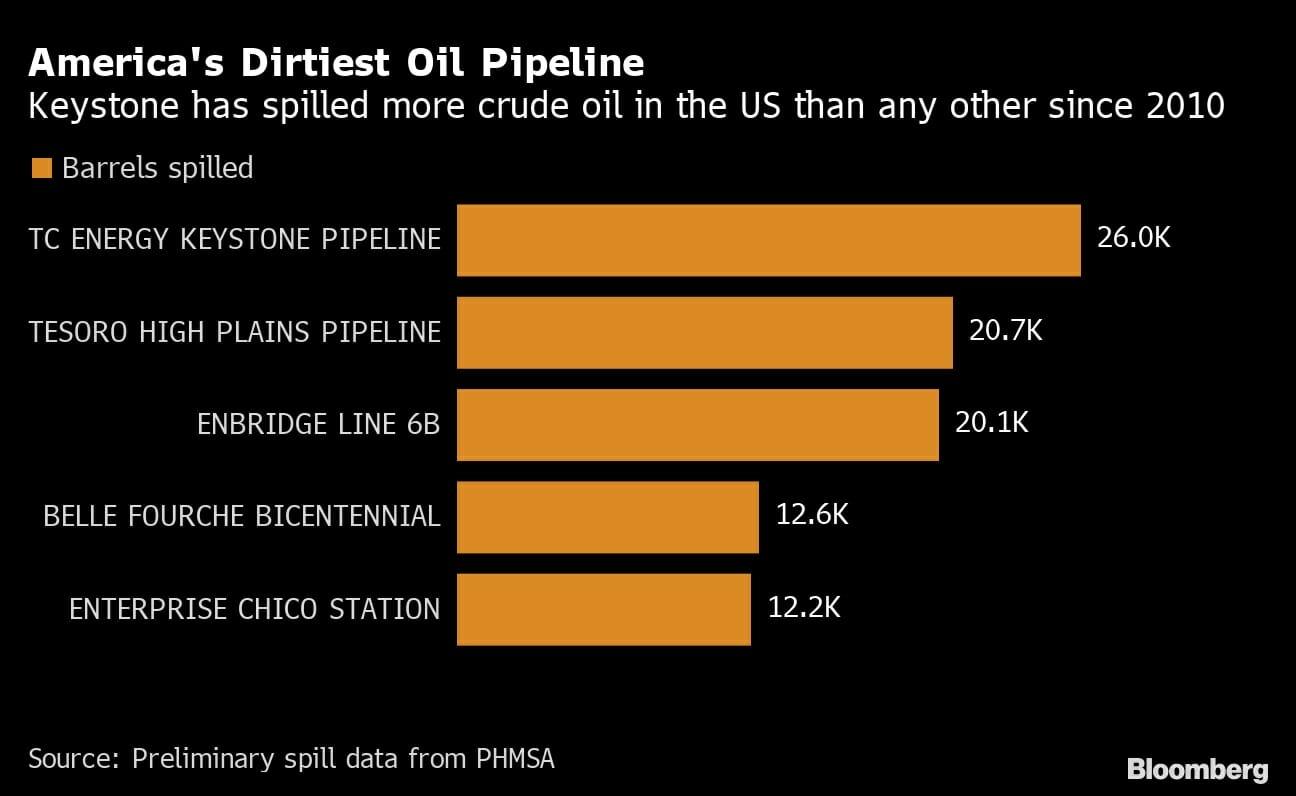
WTI crude oil is trading near the $75 mark on the NYMEX after testing its $70 support level yesterday. Keystone, one of the main pipelines operated by TC Energy that can carry about 0.6 million barrels from Alberta (Canada) to the US, has been undergoing maintenance since Wednesday after a critical leak was detected in Kansas.
Get The Full Henry Singleton Series in PDF
Get the entire 4-part series on Henry Singleton in PDF. Save it to your desktop, read it on your tablet, or email to your colleagues
q3 2022 hedge fund letters, conferences and more
Rhinophobia: The Investors DiseaseOne of the most challenging emotional problems for investors to overcome is the desire to always be fully invested. Even the best investors have the itch to keep doing things. It requires a tremendous amount of willpower to stay out of the market and sit on your hands when everything else is going up (and read more
(Source: bloomberg )
On the other hand, the easing of covid restrictions in China and Hong Kong gives hope for a rebound in the economy. According to Goldman Sachs in a report published on Sunday (Dec 11), the reopening in China could push crude oil prices up by $15. A jump in both domestic and international flights in China is to be noticed.
Similarly, the removal of a three-day monitoring period for arrivals in Hong Kong marks a shift in health restrictive policies.
Weather
Another element capable of restoring momentum to the market is the degraded weather conditions in the northern hemisphere – also likely to fuel demand.
Firstly, in Europe, a mass of cold air from the Arctic brought temperatures down several degrees below seasonal averages. Secondly, in the United States, a cold front will sweep through much of the East, with negative temperatures forecast in Chicago, Cleveland, and Indianapolis.
Technical Charts
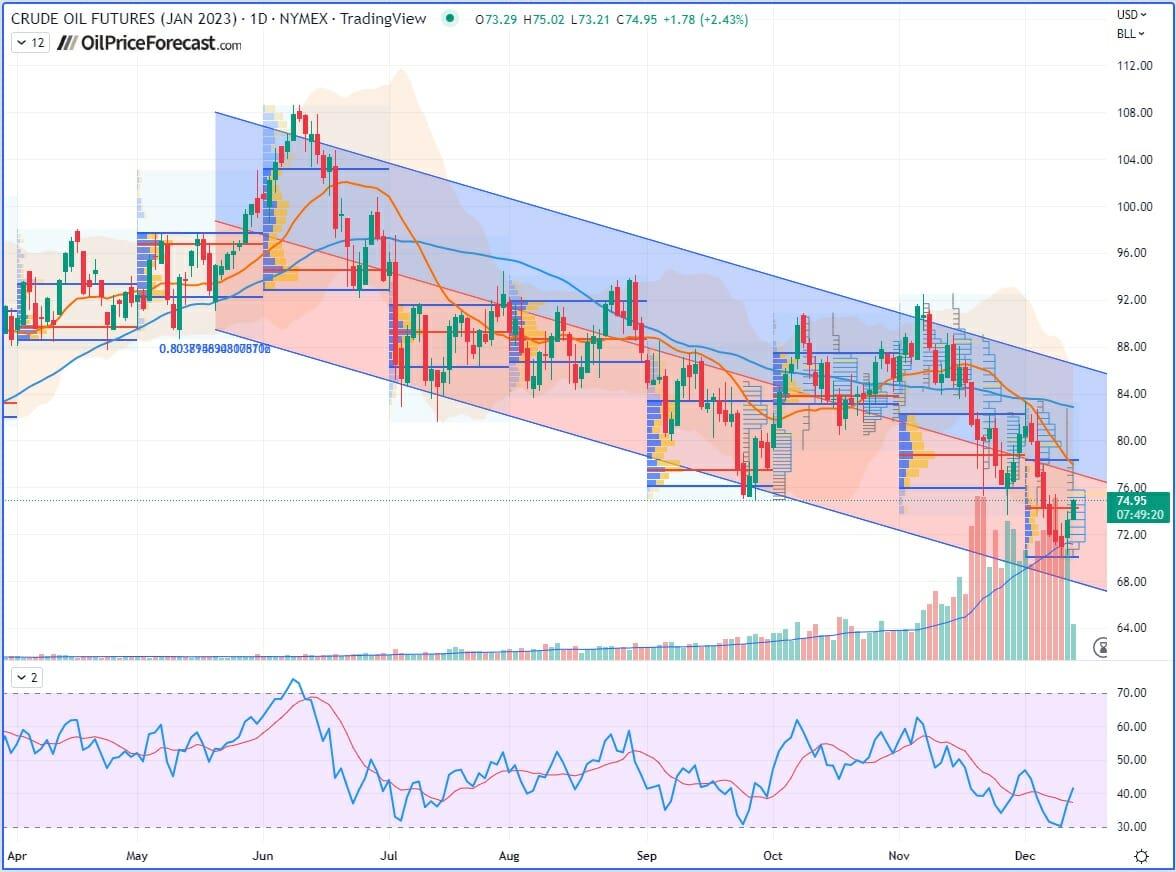
WTI Crude Oil (CLF23) Futures (January contract, daily chart)
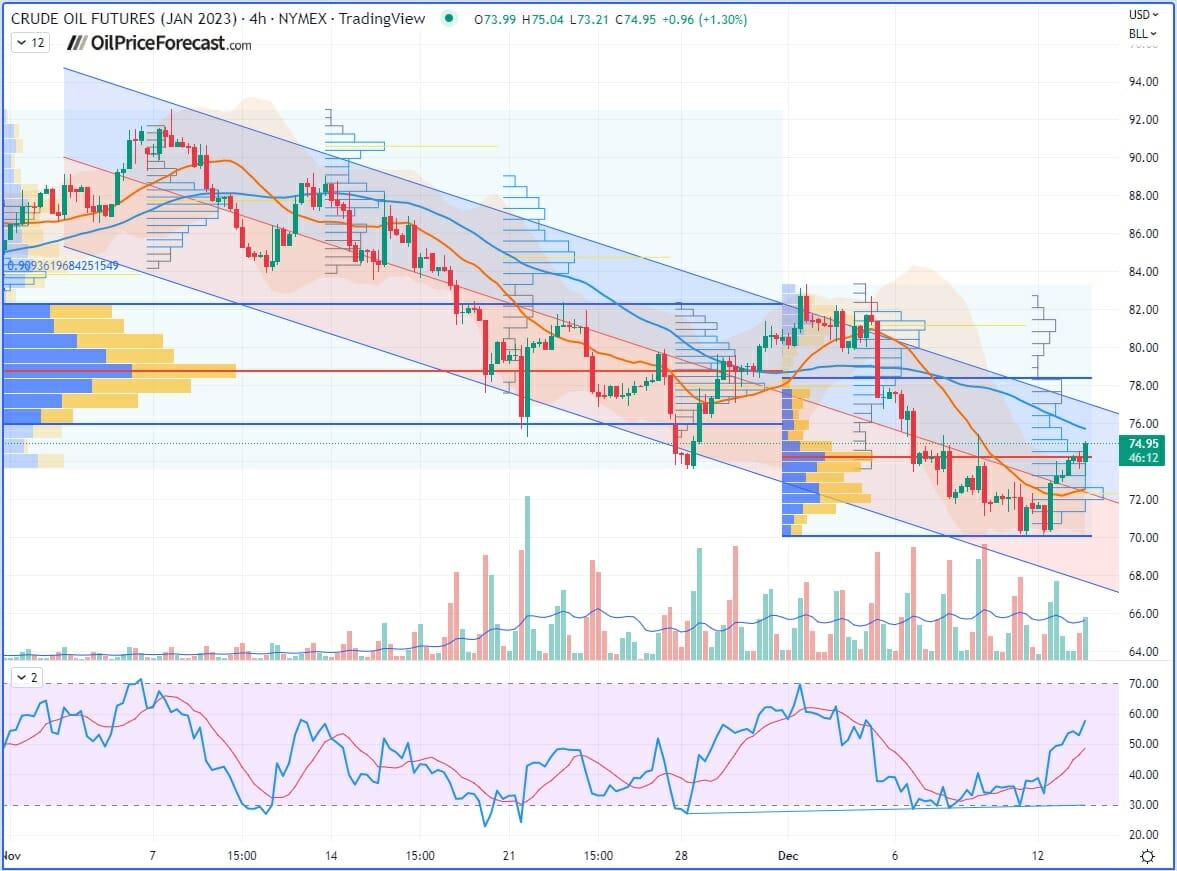
WTI Crude Oil (CLF23) Futures (January contract, 4H chart)
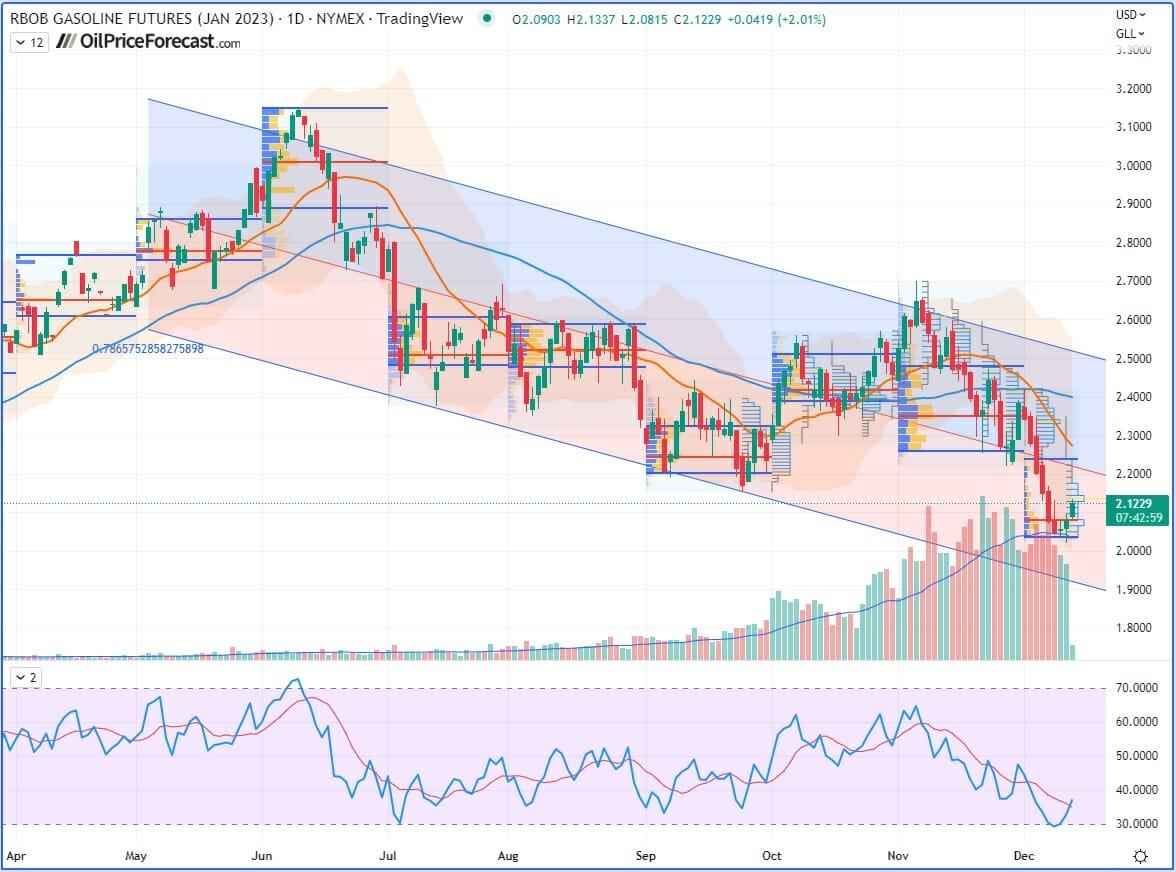
RBOB Gasoline (RBF23) Futures (January contract, daily chart)
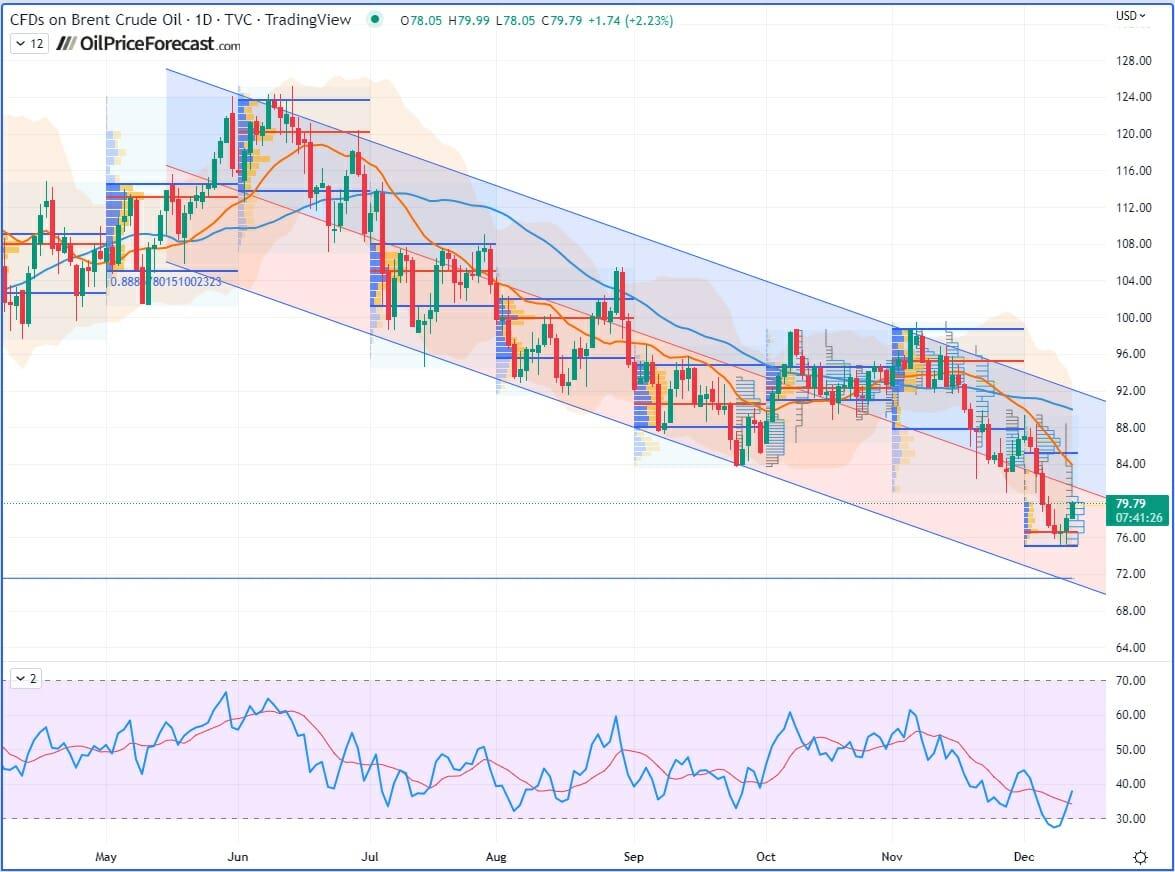
Brent Crude Oil (BRNG23) Futures (February contract, daily chart) – Contract for Difference (CFD) UKOIL
Like what you've read? Subscribe for our daily newsletter today, and you'll get 7 days of FREE access to our premium daily Oil Trading Alerts as well as our other Alerts. sign up for the free newsletter today!
Thank you.
Sebastien Bischeri
Oil & Gas Trading Strategist
The information above represents analyses and opinions of Sebastien Bischeri, & Sunshine Profits' associates only. As such, it may prove wrong and be subject to change without notice. At the time of writing, we base our opinions and analyses on facts and data sourced from respective essays and their authors.
Although formed on top of careful research and reputably accurate sources, Sebastien Bischeri and his associates cannot guarantee the reported data's accuracy and thoroughness. The opinions published above neither recommend nor offer any securities transaction. Mr. Bischeri is not a Registered Securities Advisor.
By reading Sebastien Bischeri's reports you fully agree that he will not be held responsible or liable for any decisions you make regarding any information provided in these reports. Investing, trading and speculation in any financial markets may involve high risk of loss.
Sebastien Bischeri, Sunshine Profits' employees, affiliates as well as their family members may have a short or long position in any securities, including those mentioned in any of the reports or essays, and may make additional purchases and/or sales of those securities without notice.


Comments
No comment