


403
Sorry!!
Error! We're sorry, but the page you were looking for doesn't exist.
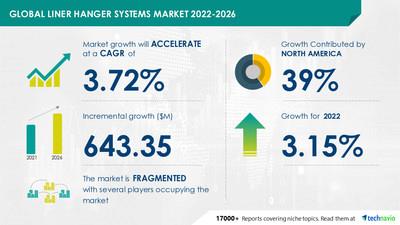
Liner Hanger Systems Market Size To Grow By USD 643.35 | 39% Of Market Growth To Originate From North America | Technavio'
(MENAFN- PR Newswire)
Technavio has announced its latest market research report titled Liner Hanger Systems Market by Application and Geography - Forecast and Analysis 2020-2024
NEW YORK, May 5, 2022 /PRNewswire/ -- The liner hanger systems market has been categorized as a part of the global oil field equipment and services market within the global oil and gas market. The market size is anticipated to grow by USD 643.35 mn from 2021 to 2026. Moreover, the growth momentum of the market will progress at a CAGR of 3.72% during the forecast period.
Find additional highlights related to the market. View our Sample Report Now
Technavio has announced its latest market research report titled Liner Hanger Systems Market by Application and Geography - Forecast and Analysis 2020-2024
Market Dynamics
The global growth in liquid fuel consumption is driving the global liner hanger systems market growth. Rapid urbanization and industrialization have led to an increase in fuel consumption in many countries. The growth in transportation services is also leading to higher consumption of fuel in developing economies, which is increasing the need for more oil production.
The cessation of world bank funding for E&P activities is challenging the liner hanger systems market growth. For instance, in December 2017, the World Bank Group announced that it would not make new investments in upstream oil and gas after 2019, except under special conditions.
Learn about other drivers and challenges impacting the growth of the market. View our Sample Report Now
Company Profiles
The liner hanger systems market is fragmented, and the vendors are deploying growth strategies such as acquisitions and business expansion to compete in the market.
The liner hanger systems market report provides complete insights on key vendors, including Allamon Tool Co Inc., Baker Hughes Co., BOTIL Oil Tools India Pvt. Ltd., DEW Wartungs und Reparatur GmbH, Dril Quip Inc., Halliburton Co., Innovex, Maximus Completion Systems, NCS Multistage Holdings Inc., NOV Inc., Packers Plus Energy Services Inc., Peak Completion Technologies Inc., Saga-PCE Pte. Ltd., SAZ Oilfield Services Pte. Ltd., Schlumberger Ltd., TANGENTOG EQUIPMENT AND SUPPLY PVT. Ltd., Tianjin Elegant Technology Co. Ltd., Weatherford International Plc, Well Innovation AS, and Wellcare Oil Tools Pvt. Ltd.
Competitive Analysis
The competitive scenario provided in the liner hanger systems market report analyzes, evaluates, and positions companies based on various performance indicators. Some of the factors considered for this analysis include the financial performance of companies over the past few years, growth strategies, product innovations, new product launches, investments, growth in market share, etc.
Market Segmentation
- By application, the market is classified into onshore and offshore. The onshore segment will contribute the largest share of the market. An increase in shale oil and gas E&P activities will support the growth of the onshore oil and gas equipment market. This, in turn, will drive the global liner hanger systems market in the coming years.
- By geography, the market is classified into North America, APAC, Middle East and Africa, Europe, and South America. North America will have the largest share of the market. The high adoption rates of liner hanger systems in the US, Canada, and Argentina, among other countries, owing to the presence of abundant unconventional oil and gas reserves, will drive the liner hanger systems market growth in North America during the forecast period.
Find out the contribution of each segment of the market. View our Sample Report Now
Related Reports
Subsea Production and Processing Market by Application and Geography - Forecast and Analysis 2022-2026
Oil and Gas Upstream Equipment Market by Application and Geography - Forecast and Analysis 2022-2026
| Liner Hanger Systems Market Scope | |
| Report Coverage | Details |
| Page number | 120 |
| Base year | 2021 |
| Forecast period | 2022-2026 |
| Growth momentum & CAGR | Accelerate at a CAGR of 3.72% |
| Market growth 2022-2026 | USD 643.35 million |
| Market structure | Fragmented |
| YoY growth (%) | 3.15 |
| Regional analysis | North America, APAC, Middle East and Africa, Europe, and South America |
| Performing market contribution | North America at 39% |
| Key consumer countries | US, Canada, Saudi Arabia, China, and Russia |
| Competitive landscape | Leading companies, competitive strategies, consumer engagement scope |
| Companies profiled | Allamon Tool Co Inc., Baker Hughes Co., BOTIL Oil Tools India Pvt. Ltd., DEW Wartungs und Reparatur GmbH, Dril Quip Inc., Halliburton Co., Innovex, Maximus Completion Systems, NCS Multistage Holdings Inc., NOV Inc., Packers Plus Energy Services Inc., Peak Completion Technologies Inc., Saga-PCE Pte. Ltd., SAZ Oilfield Services Pte. Ltd., Schlumberger Ltd., TANGENTOG EQUIPMENT AND SUPPLY PVT. Ltd., Tianjin Elegant Technology Co. Ltd., Weatherford International Plc, Well Innovation AS, and Wellcare Oil Tools Pvt. Ltd. |
| Market Dynamics | Parent market analysis, Market growth inducers and obstacles, Fast-growing and slow-growing segment analysis, COVID 19 impact and future consumer dynamics, market condition analysis for forecast period, |
| Customization purview | If our report has not included the data that you are looking for, you can reach out to our analysts and get segments customized. |
Table of Contents
1. Executive Summary
1.1 Market overview
Exhibit 01: Executive Summary – Chart on Market Overview
Exhibit 02: Executive Summary – Data Table on Market Overview
Exhibit 03: Executive Summary – Chart on Global Market Characteristics
Exhibit 04: Executive Summary – Chart on Market by Geography
Exhibit 05: Executive Summary – Chart on Market Segmentation by End-user
Exhibit 06: Executive Summary – Chart on Incremental Growth
Exhibit 07: Executive Summary – Data Table on Incremental Growth
Exhibit 08: Executive Summary – Chart on Vendor Market Positioning
2. Market Landscape
2.1 Market ecosystem
Exhibit 09: Parent market
Exhibit 10: Market Characteristics
3. Market Sizing
3.1 Market definition
Exhibit 11: Offerings of vendors included in the market definition
3.2 Market segment analysis
Exhibit 12: Market segments
3.3 Market size 2021
3.4 Market outlook: Forecast for 2021-2026
Exhibit 13: Chart on Global - Market size and forecast 2021-2026 ($ million)
Exhibit 14: Data Table on Global - Market size and forecast 2021-2026 ($ million)
Exhibit 15: Chart on Global Market: Year-over-year growth 2021-2026 (%)
Exhibit 16: Data Table on Global Market: Year-over-year growth 2021-2026 (%)
4. Five Forces Analysis
4.1 Five Forces Summary
Exhibit 17: Five forces analysis - Comparison between2021 and 2026
4.2 Bargaining power of buyers
Exhibit 18: Chart on Bargaining power of buyers – Impact of key factors 2021 and 2026
4.3 Bargaining power of suppliers
Exhibit 19: Bargaining power of suppliers – Impact of key factors in 2021 and 2026
4.4 Threat of new entrants
Exhibit 20: Threat of new entrants – Impact of key factors in 2021 and 2026
4.5 Threat of substitutes
Exhibit 21: Threat of substitutes – Impact of key factors in 2021 and 2026
4.6 Threat of rivalry
Exhibit 22: Threat of rivalry – Impact of key factors in 2021 and 2026
4.7 Market condition
Exhibit 23: Chart on Market condition - Five forces 2021 and 2026
5. Market Segmentation by Application
5.1 Market segments
Exhibit 24: Chart on Application - Market share 2021-2026 (%)
Exhibit 25: Data Table on Application - Market share 2021-2026 (%)
5.2 Comparison by Application
Exhibit 26: Chart on Comparison by Application
Exhibit 27: Data Table on Comparison by Application
5.3 Onshore - Market size and forecast 2021-2026
Exhibit 28: Chart on Onshore - Market size and forecast 2021-2026 ($ million)
Exhibit 29: Data Table on Onshore - Market size and forecast 2021-2026 ($ million)
Exhibit 30: Chart on Onshore - Year-over-year growth 2021-2026 (%)
Exhibit 31: Data Table on Onshore - Year-over-year growth 2021-2026 (%)
5.4 Offshore - Market size and forecast 2021-2026
Exhibit 32: Chart on Offshore - Market size and forecast 2021-2026 ($ million)
Exhibit 33: Data Table on Offshore - Market size and forecast 2021-2026 ($ million)
Exhibit 34: Chart on Offshore - Year-over-year growth 2021-2026 (%)
Exhibit 35: Data Table on Offshore - Year-over-year growth 2021-2026 (%)
5.5 Market opportunity by Application
Exhibit 36: Market opportunity by Application ($ million)
6. Customer landscape
Technavio's customer landscape matrix comparing Drivers or price sensitivity, Adoption lifecycle, importance in customer price basket, Adoption rate and Key purchase criteria
6.1 Customer landscape overview
Exhibit 37: Analysis of price sensitivity, lifecycle, customer purchase basket, adoption rates, and purchase criteria
5 Market Segmentation by Geography
Exhibit 38: Chart on Market share by geography 2021-2026 (%)
Exhibit 39: Data Table on Market share by geography 2021-2026 (%)
7.2 Geographic comparison
Exhibit 40: Chart on Geographic comparison
Exhibit 41: Data Table on Geographic comparison
7.3 North America - Market size and forecast 2021-2026
Exhibit 42: Chart on North America - Market size and forecast 2021-2026 ($ million)
Exhibit 43: Data Table on North America - Market size and forecast 2021-2026 ($ million)
Exhibit 44: Chart on North America - Year-over-year growth 2021-2026 (%)
Exhibit 45: Data Table on North America - Year-over-year growth 2021-2026 (%)
7.4 APAC - Market size and forecast 2021-2026
Exhibit 46: Chart on APAC - Market size and forecast 2021-2026 ($ million)
Exhibit 47: Data Table on APAC - Market size and forecast 2021-2026 ($ million)
Exhibit 48: Chart on APAC - Year-over-year growth 2021-2026 (%)
Exhibit 49: Data Table on APAC - Year-over-year growth 2021-2026 (%)
7.5 Middle East and Africa - Market size and forecast 2021-2026
Exhibit 50: Chart on Middle East and Africa - Market size and forecast 2021-2026 ($ million)
Exhibit 51: Data Table on Middle East and Africa - Market size and forecast 2021-2026 ($ million)
Exhibit 52: Chart on Middle East and Africa - Year-over-year growth 2021-2026 (%)
Exhibit 53: Data Table on Middle East and Africa - Year-over-year growth 2021-2026 (%)
7.6 Europe - Market size and forecast 2021-2026
Exhibit 54: Chart on Europe - Market size and forecast 2021-2026 ($ million)
Exhibit 55: Data Table on Europe - Market size and forecast 2021-2026 ($ million)
Exhibit 56: Chart on Europe - Year-over-year growth 2021-2026 (%)
Exhibit 57: Data Table on Europe - Year-over-year growth 2021-2026 (%)
7.7 South America - Market size and forecast 2021-2026
Exhibit 58: Chart on South America - Market size and forecast 2021-2026 ($ million)
Exhibit 59: Data Table on South America - Market size and forecast 2021-2026 ($ million)
Exhibit 60: Chart on South America - Year-over-year growth 2021-2026 (%)
Exhibit 61: Data Table on South America - Year-over-year growth 2021-2026 (%)
7.8 US - Market size and forecast 2021-2026
Exhibit 62: Chart on US - Market size and forecast 2021-2026 ($ million)
Exhibit 63: Data Table on US - Market size and forecast 2021-2026 ($ million)
Exhibit 64: Chart on US - Year-over-year growth 2021-2026 (%)
Exhibit 65: Data Table on US - Year-over-year growth 2021-2026 (%)
7.9 China - Market size and forecast 2021-2026
Exhibit 66: Chart on China - Market size and forecast 2021-2026 ($ million)
Exhibit 67: Data Table on China - Market size and forecast 2021-2026 ($ million)
Exhibit 68: Chart on China - Year-over-year growth 2021-2026 (%)
Exhibit 69: Data Table on China - Year-over-year growth 2021-2026 (%)
7.10 Canada - Market size and forecast 2021-2026
Exhibit 70: Chart on Canada - Market size and forecast 2021-2026 ($ million)
Exhibit 71: Data Table on Canada - Market size and forecast 2021-2026 ($ million)
Exhibit 72: Chart on Canada - Year-over-year growth 2021-2026 (%)
Exhibit 73: Data Table on Canada - Year-over-year growth 2021-2026 (%)
7.11 Saudi Arabia - Market size and forecast 2021-2026
Exhibit 74: Chart on Saudi Arabia - Market size and forecast 2021-2026 ($ million)
Exhibit 75: Data Table on Saudi Arabia - Market size and forecast 2021-2026 ($ million)
Exhibit 76: Chart on Saudi Arabia - Year-over-year growth 2021-2026 (%)
Exhibit 77: Data Table on Saudi Arabia - Year-over-year growth 2021-2026 (%)
7.12 Market opportunity by geography
Exhibit 78: Market opportunity by geography ($ million)
8. Drivers, Challenges, and Trends
8.1 Market drivers
8.1.1 Global growth in liquid fuel consumption
8.1.2 Increase in oil and gas E and P activities
8.1.3 Increasing upstream investment
8.2 Market challenges
8.2.1 Cessation of World Bank funding for E and P activities
8.2.2 Volatility in oil and gas prices
8.2.3 Increasing investments in renewable energy
8.3 Impact of drivers and challenges
Exhibit 79: Impact of drivers and challenges in 2021 and 2026
8.4 Market trends
8.4.1 Increase in deepwater and ultra-deepwater exploration
8.4.2 Innovations in liner hanger technology
8.4.3 Rise in world refining capacity
9. Vendor Landscape
9.1 Overview
9.2 Vendor landscape
Exhibit 80: Overview on Criticality of inputs and Factors of differentiation
9.3 Landscape disruption
Exhibit 81: Overview on factors of disruption
9.4 Industry risks
Exhibit 82: Impact of key risks on business
10. Vendor Analysis
10.1 Vendors covered
Exhibit 83: Vendors covered
10.2 Market positioning of vendors
Exhibit 84: Matrix on vendor position and classification
10.3 Allamon Tool Co Inc.
Exhibit 85: Allamon Tool Co Inc. - Overview
Exhibit 86: Allamon Tool Co Inc. - Product / Service
Exhibit 87: Allamon Tool Co Inc. - Key offerings
10.4 Baker Hughes Co.
Exhibit 88: Baker Hughes Co. - Overview
Exhibit 89: Baker Hughes Co. - Business segments
Exhibit 90: Baker Hughes Co. - Key news
Exhibit 91: Baker Hughes Co. - Key offerings
Exhibit 92: Baker Hughes Co. - Segment focus
10.5 DEW Wartungs und Reparatur GmbH
Exhibit 93: DEW Wartungs und Reparatur GmbH - Overview
Exhibit 94: DEW Wartungs und Reparatur GmbH - Product / Service
Exhibit 95: DEW Wartungs und Reparatur GmbH - Key offerings
10.6 Dril Quip Inc.
Exhibit 96: Dril Quip Inc. - Overview
Exhibit 97: Dril Quip Inc. - Business segments
Exhibit 98: Dril Quip Inc. - Key offerings
Exhibit 99: Dril Quip Inc. - Segment focus
10.7 Halliburton Co.
Exhibit 100: Halliburton Co. - Overview
Exhibit 101: Halliburton Co. - Product / Service
Exhibit 102: Halliburton Co. - Key news
Exhibit 103: Halliburton Co. - Key offerings
10.8 Innovex
Exhibit 104: Innovex - Overview
Exhibit 105: Innovex - Product / Service
Exhibit 106: Innovex - Key offerings
10.9 NOV Inc.
Exhibit 107: NOV Inc. - Overview
Exhibit 108: NOV Inc. - Business segments
Exhibit 109: NOV Inc. - Key news
Exhibit 110: NOV Inc. - Key offerings
Exhibit 111: NOV Inc. - Segment focus
10.10 Packers Plus Energy Services Inc.
Exhibit 112: Packers Plus Energy Services Inc. - Overview
Exhibit 113: Packers Plus Energy Services Inc. - Product / Service
Exhibit 114: Packers Plus Energy Services Inc. - Key offerings
10.11 Schlumberger Ltd.
Exhibit 115: Schlumberger Ltd. - Overview
Exhibit 116: Schlumberger Ltd. - Business segments
Exhibit 117: Schlumberger Ltd. - Key offerings
About Us
Technavio is a leading global technology research and advisory company. Their research and analysis focus on emerging market trends and provide actionable insights to help businesses identify market opportunities and develop effective strategies to optimize their market positions. With over 500 specialized analysts, Technavio's report library consists of more than 17,000 reports and counting, covering 800 technologies, spanning across 50 countries. Their client base consists of enterprises of all sizes, including more than 100 Fortune 500 companies. This growing client base relies on Technavio's comprehensive coverage, extensive research, and actionable market insights to identify opportunities in existing and potential markets and assess their competitive positions within changing market scenarios.
Contact
Technavio ResearchJesse MaidaMedia & Marketing ExecutiveUS: +1 844 364 1100UK: +44 203 893 3200Email: [email protected] Website:
SOURCE Technavio

Legal Disclaimer:
MENAFN provides the
information “as is” without warranty of any kind. We do not accept
any responsibility or liability for the accuracy, content, images,
videos, licenses, completeness, legality, or reliability of the information
contained in this article. If you have any complaints or copyright
issues related to this article, kindly contact the provider above.
Most popular stories
Market Research

More Story


Comments
No comment