


403
Sorry!!
Error! We're sorry, but the page you were looking for doesn't exist.

How to Trade the Dark Cloud Cover Candlestick
(MENAFN- DailyFX) 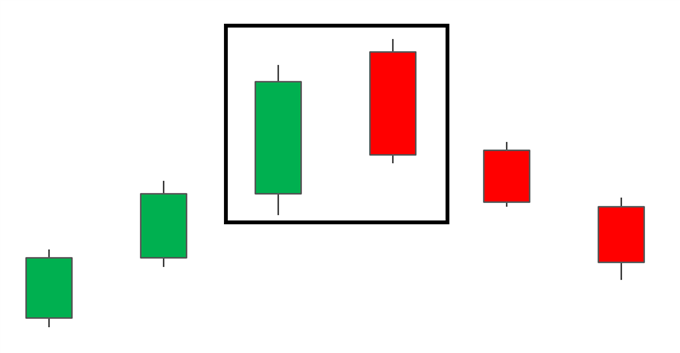
 How to trade using the Dark Cloud Pattern
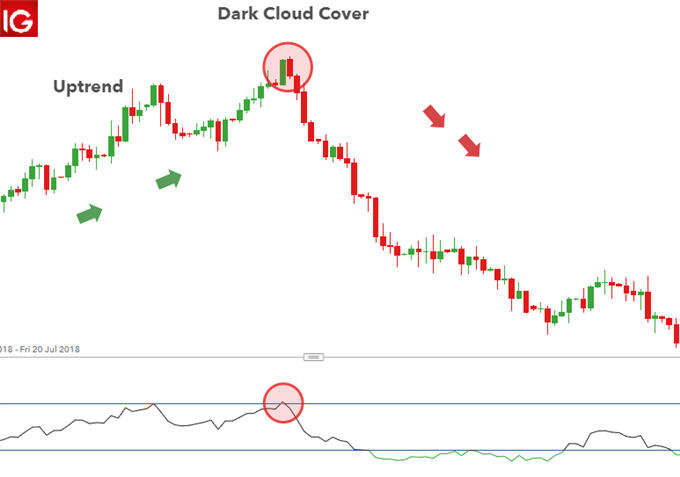

 Advantages and limitations of the Dark Cloud
Further Reading on Forex Trading PatternsThere are many bearish candle formations. Some of the top bearish candle patterns include: Bearish Engulfing PatternBearish Harami PatternBearish Evening Star Candlestick analysis is an essential part of technical analysis. Find out which candlesticks make it into theTop 10 Candlestick patternsall traders should know. Technical analysis is just one of three ways to analyze financial markets. The others include, fundamental analysis and sentiment analysis. Learn more about these different types of analysis by reading thethree types of forex analysis .
The Dark Cloud Cover pattern is used by many traders to spot reversals in the market and achieve favorable risk to reward ratios. It is fairly easy to spot, however, traders need to view the formation of the Dark Cloud Cover candlestick in conjunction with other crucial factors and avoid simply trading as soon as the pattern appears.
The Dark Cloud Cover is a type offorex candlestick , and before continuing, readers should ensure they have a good grasp onhow to read a candlestick chart .
This article will cover the following:
What is a Dark Cloud Cover pattern? How to identify a Dark Cloud on forex charts How to trade using the Dark Cloud Cover Advantages and limitationsHow well do you know your trading patterns? Test yourself with our interactiveforex trading patterns quiz
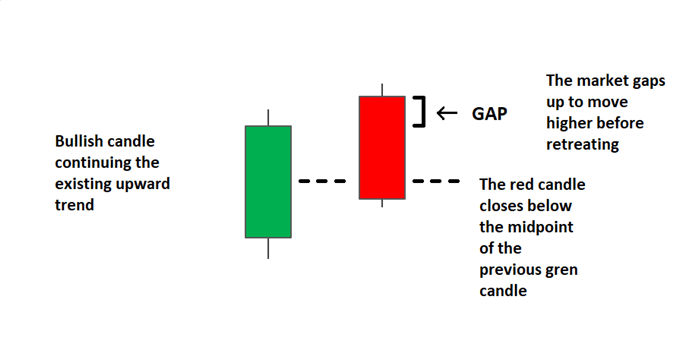
What is a Dark Cloud Cover Pattern?The Dark Cloud Cover pattern is a candlestick pattern that signals a potential reversal to the downside. It appears at the top of an uptrend and involves a large green (bullish) candle, followed by a red (bearish) candle that creates a new high before closing lower than the midway point of the previous green candle.
This candle formation, although very similar, should not be confused with theBearish Engulfing candlepattern. Both patterns signal a potential trend reversal but the Dark Cloud Cover offers more attractive entry levels due to a higher close of the bearish candle than that observed with the bearish engulfing candle pattern.
How to identify a Dark Cloud on Forex ChartsDark Cloud Cover checklist:
Identify existing uptrend. Look for signals that momentum is slowing/reversing ( stochastic oscillators , bearishmoving averagecrossover, or subsequent bearish candle formations). Stocks will gap up, with the red candle opening above the previous green candle however, this is very rarely found in forex candlesticks as these candles will mostly open at the same level as the prior candle's close, or very close to it. Ensure that the red candle closes lower than the midway point of the previous green candle. Look for confirmation of the new downward trend How to trade using the Dark Cloud PatternTraders can look to trade more traditional trending markets such as theGBP/USDorEUR/USD , but can also incorporate Dark Cloud Cover technical analysis inranging markets .
Trending markets
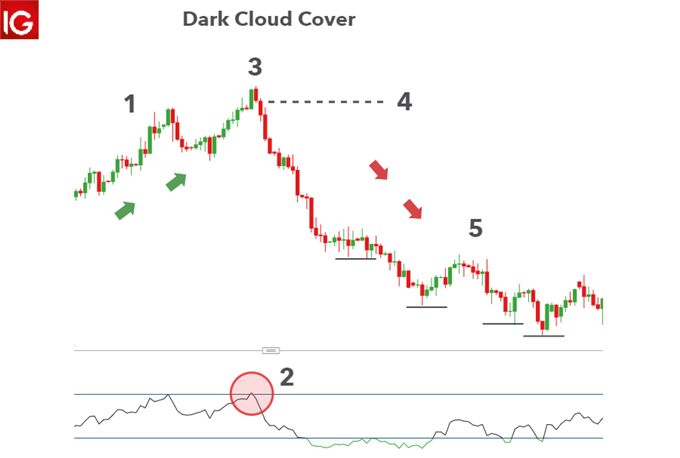
Below is an example of the Dark Cloud Cover pattern in forex, specifically, theGBP/USDforex pair. Refer to the chart for more information.
This Dark Cloud Cover checklist can be used to analyze a potential trade:
The existence of higher highs and higher lows presents us with an uptrend. On the chart, one can observe that the market had started to move more sideways as the latest upward move initially moved sideways and when it did move up, this was not as sharp a move as previously observed. Furthermore, theRSImoved into overbought territory providing a greater level of conviction to the trade. The red candle gaps slightly above the previous green candle. In theforex marketthe candle will mostly open at the same level as the previous close. The red bearish candle proceeds lower and closes below the midway point of the bullish candle, showing that the bears are outweighing the bulls at that level. Confirmation of continued selling (downward pressure) is seen in the very next candle and subsequent candles after that. Lower highs and lower lows then provide the evidence that the market had reversed successfully, and a downtrend was established. Entry levels, targets and stops can be easily identified when taking a look at the zoomed in chart below. The entry can be placed at the open of the next candle, after the Dark Cloud Cover pattern has formed.
Stopscan be placed above the recent swing high and the initial target level can be set at key levels or recent areas of support/resistance. It is worth noting that because the trade is potentially the starting point of an extended move down, traders can set multiple target levels.
Learn more abouttrading with support and resistance .
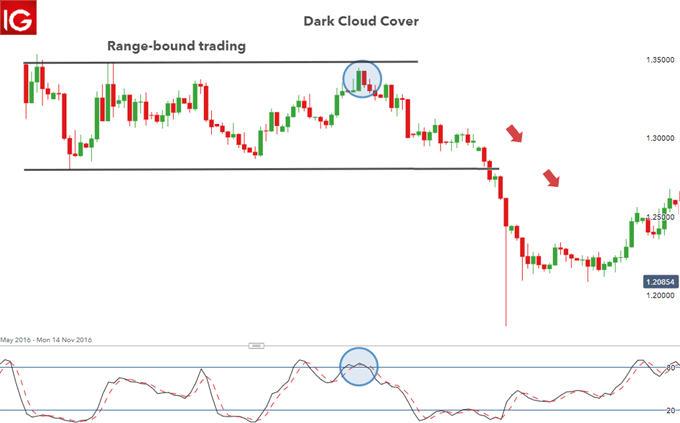
Ranging markets
A similar strategy can be applied in a ranging market where price tends to 'bounce' between support and resistance. The below example shows a period of consolidation in GBP/USD when it was clearly not trending in any direction. The Dark Cloud Cover pattern appearing near resistance provides a short signal and should there be enough momentum, could turn into a breakout trade - as it did in this example.
Advantages and limitations of the Dark CloudThe validity of the Dark Cloud, like all othercandlestick patterns , depends on theprice actionaround it, indicators, where it appears in the trend, and key levels of resistance. Below are some of the advantages and limitations of this pattern.
| Advantages | Limitations |
| Attractive entry levels as the pattern appears at the start of a potential downtrend | Should not be traded based on its formation alone |
| The Dark Cloud Cover can offer a more attractive risk to reward ratio when compared to theBearish Engulfing pattern | Where the pattern occurs within the trend is crucial. Must appear at the top of an uptrend |
| Easy to identify for novice traders | The Dark Cloud Cover candle requires an understanding of supporting technical analysis or indicators. Popular:StochasticsandRSI |

Legal Disclaimer:
MENAFN provides the
information “as is” without warranty of any kind. We do not accept
any responsibility or liability for the accuracy, content, images,
videos, licenses, completeness, legality, or reliability of the information
contained in this article. If you have any complaints or copyright
issues related to this article, kindly contact the provider above.
Most popular stories
Market Research

More Story


Comments
No comment