


403
Sorry!!
Error! We're sorry, but the page you were looking for doesn't exist.

DAX Price Analysis: Facing Key Support Levels
(MENAFN- DailyFX) DAXPrice Forecast
DAX Charts and Analysis DAX price U- turned at 11-month high.See our free trading guide to help build confidence when you trade onEUR,USDand other main currenciesDownload for free our latest Q3 trading guides
DAX – Correcting LowerOn July 3,Dax peakedat 12,662 – its highest level in nearly 11months. On the following days, the price corrected lower breaking below the July 1 low at 12,471.
Alongside, the Relative Strength Index (RSI) fell from 70 and yesterday crossed below 50 indicating to the weakness of the uptrend momentum with a possible start of a downtrend.
Just getting started?See our Beginners' Guide for FX traders
DAX DAILY PRICE CHART (Aril 30, 2017 – JULY 12, 2019) Zoomed out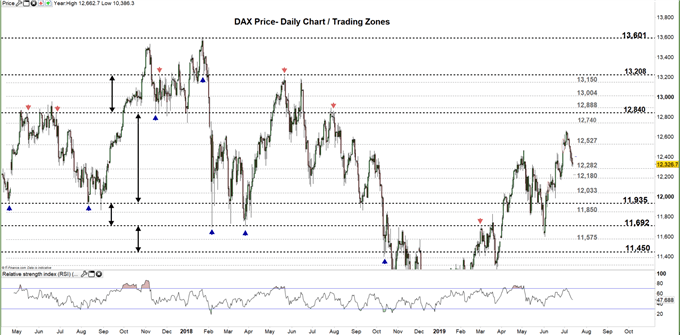 DAX DAILY PRICE CHART (May 8 – JULY 12, 2019) Zoomed IN
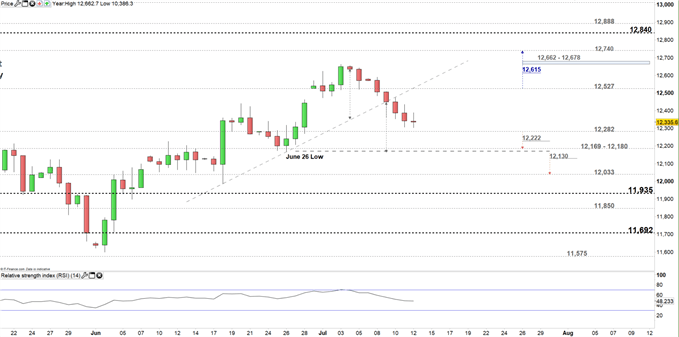
Looking at the daily chart we notice at the start of the week Dax moved to a lower trading zone 12,282 – 12,527, looking for a test of the low end of this zone. Additionally, the price broke below the uptrend line originated from July 18 low at 11,984 eyeing a test of the June 26 low at 12,169.
A close below the low end of the aforementioned trading zone could pave the way towards 12,180, however; the weekly support marked on the chart (zoomed in) needs to be kept in focus. See the chart to know more about the key levels if the selloff continues beyond the mentioned level.
On the flip-side, a failure to close below the low end may cause a rally to the high end. Further close above the high end might lead the price towards 12,740, nonetheless; the daily and weekly resistance level and zone highlighted on the chart need to be watched along the way.
Having trouble with your trading strategy?Here's the #1 Mistake That Traders Make
DAX Four-HOUR PRICE CHART (June 18 – July 12, 2019)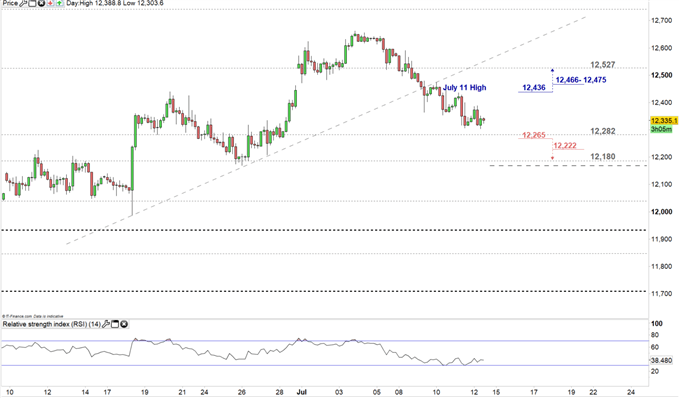
Looking at the four-hour chart, we notice on Tuesday Dax started a downtrend move creating lower highs with lower lows. Yesterday, the price rallied carving out a high at 12,436, therefore; a break above this high could send the index towards 12,527, however; the daily resistance zone underlined on the chart needs to be considered.
On the other hand, if the bearish move continues, then a break below 12,265 may press the price towards 12,180, although the weekly support level mentioned on the chart needs to be monitored.
Written By:Mahmoud Alkudsi
Please feel free to contact me on Twitter: @Malkudsi

Legal Disclaimer:
MENAFN provides the
information “as is” without warranty of any kind. We do not accept
any responsibility or liability for the accuracy, content, images,
videos, licenses, completeness, legality, or reliability of the information
contained in this article. If you have any complaints or copyright
issues related to this article, kindly contact the provider above.
Most popular stories
Market Research

More Story


Comments
No comment