


403
Sorry!!
Error! We're sorry, but the page you were looking for doesn't exist.

Using Rectangle Patterns to Trade Breakouts
(MENAFN- DailyFX) Rectangle chart patterns and trading breakouts: Main talking points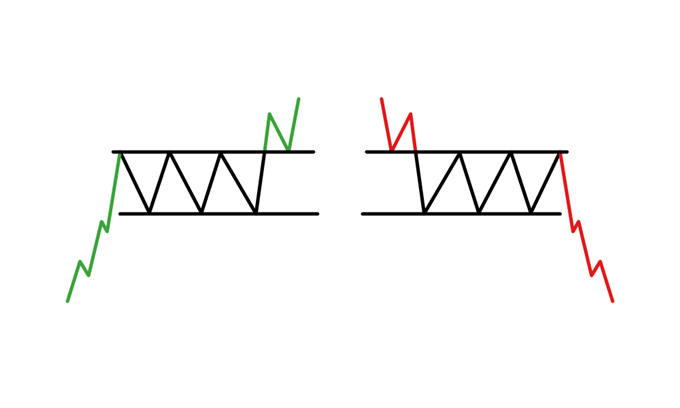
 Advantages of using rectangle patterns to trade breakouts
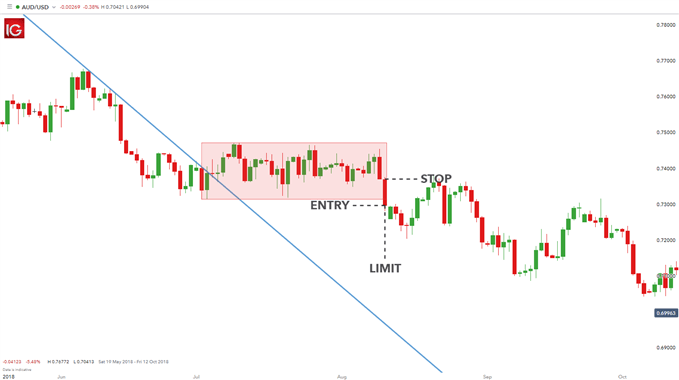
Breakoutscan generally offer some of the higher potential risk/reward setups, allowing traders to keep stops tight relative to potential profit target. One very popular way of doing so is by trading the 'rectangle,' pattern, which develops when price collects between a defined support and resistance zone. The trader waits for periods in which price consolidates before the pair makes its next major move.
This article will cover:
What is a rectangle pattern? Advantages of using rectangle patterns to trade breakouts Trading tips and strategies What is a rectangle pattern?The rectangle pattern characterizes a pause in trend whereby price moves sideways between a parallelsupport and resistancezone. The pattern usually represents a consolidation in price before continuing in the original direction of the existingtrend .
A confirmation candle close outside of the upper or lower bound indicates an end to the rectangle pattern and signals the breakout direction of the continuing trend. Traders must always be aware of potential reversals in trend by analyzing the overall chart, which may illustrate larger macro patterns.
The rectangle pattern can be seen within an uptrend or downtrend. The images below outline these two scenarios representing a bullish and bearish rectangle respectively.
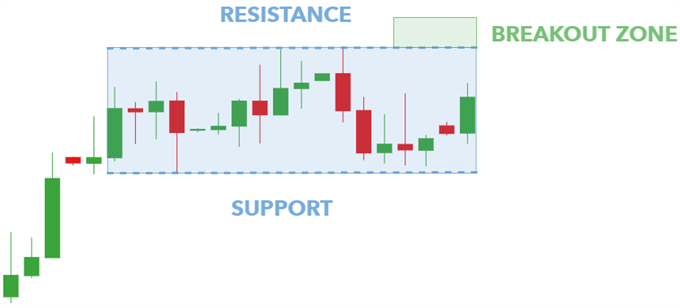
Bullish rectangle pattern:
A continuation pattern occurring within an uptrend, whereby traders look to enter into long positions once price breaks support and closes inside the 'breakout zone'.
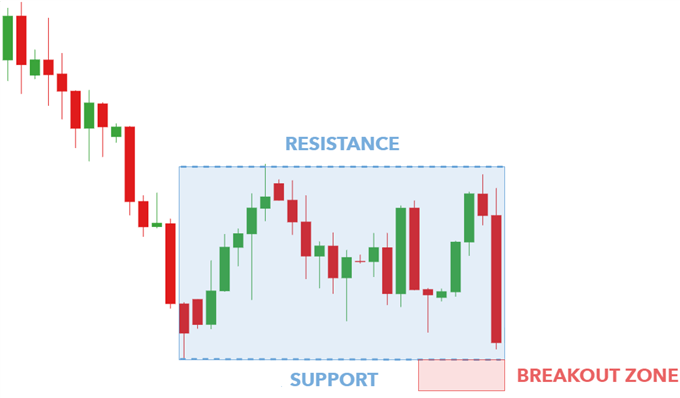
Bearish rectangle pattern:
A continuation pattern occurring in a downtrend, whereby traders look to enter into short positions once price breaks support and closes inside the 'breakout zone'.
Advantages of using rectangle patterns to trade breakoutsThere are several reasons why rectangle patterns are a popular choice among traders when it comes to breakout strategy:
Relatively simple to demarcate support and resistance lines within the rectangle Can be implemented in different markets Concept is simple to understand for novice traders – recognizing a consolidation pattern within a pre-existing trend, and then trading the breakoutEntry ,stopandlimit levelsare easy to recognize and implement within the trade Used as a breakout strategy or range bound strategyUltimately, breakouts entail price moving through an established support or resistance level, and rectangle patterns form these barrier channels. This means they are directly linked to breakout trading opportunities.
Top tips to trade breakouts with the rectangle chart patternTrading forex breakouts with the rectangle pattern is relatively straightforward. The following list summarizes what traders should do when entering a trade:
Identify pre-existingtrend Make sure that there are no longer-term/macro patterns in play before committing to the rectangle pattern analysis Establish support and resistance by joining highs and lows within the 'rectangle' Wait for breakout in the original direction of the trend with a candle close below/above the support/resistance depending on trend direction – enter at the candle close By measuring the height of the rectangle and projecting that height above resistance and below support, traders can determine breakout price targetsThe chart below shows a practical example on theAUD/USDforex pair using this simple yet effective chart pattern.
This illustrates a bearish rectangle forming within a preceding downtrend, which is highlighted by the blue trend line confirming lower lows and lower highs. The rectangle starts forming when the sideways movement in price begins. This sideways movement moves laterally forming a range bound area of support and resistance (red rectangle).
Once the rectangle has been identified, the entry is marked by the candle close breakout to the downside. This would be the opposite for a bullish rectangle where traders will look to enter above the resistance close. The limit price is taken by extending the height of the rectangle downward, whilst the stop level is taken from the candle swing high resulting in a 1:2risk-reward ratio .
Further Reading on Forex Trading Patterns Reading a candlestick chartis an important foundation to have before analyzing more complex techniques such asHaramiandDoji candlesticks . We also recommend learning more about the most common types ofcandlestick patternsused to trade forex. Use indicators to increase theeffectiveness of candlestick entries . Supplement your understanding of forex candlesticks with one of our freeforex trading guides . Our experts have also put together a range oftrading forecastswhich cover major currencies,oil ,goldand even equities.
Legal Disclaimer:
MENAFN provides the
information “as is” without warranty of any kind. We do not accept
any responsibility or liability for the accuracy, content, images,
videos, licenses, completeness, legality, or reliability of the information
contained in this article. If you have any complaints or copyright
issues related to this article, kindly contact the provider above.
Most popular stories
Market Research

More Story


Comments
No comment