


The Basics of Technical Analysis
(MENAFN- DailyFX)  An Introduction to Technical Analysis
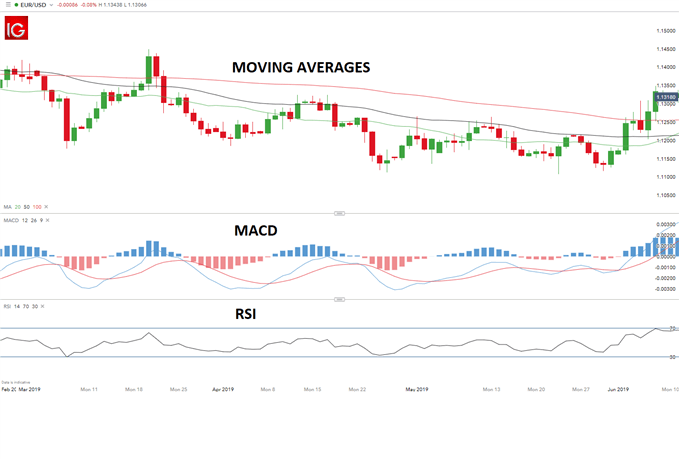
 Learn More about Technical AnalysisReview the three most commontypes of technical analysis chartsto compare techniques. Bookmark ourtechnical analysis newsfeed to stay up to date with the latest insights on current market trends. Join our in-house experts as they explore the main issues affecting trades in the live dailywebinars . Look at what makes a trader successful in theTraits of Successful Tradersmanual. Learn the basics ofForex technical analysisand the benefits of applying it in trading
An Introduction to Technical AnalysisTechnical analysis is becoming an increasingly popular approach to trading, thanks in part to the advancement in charting packages and trading platforms. However, for a novice trader, understanding technical analysis – and how it can help predict trends in the market - can be daunting and challenging.
Technical analysis is the study of price movements in a market, whereby traders make use of historicchartpatterns andindicatorsto predict future trends in the market. It is a visual representation of the past and present performance of a market and allows the trader to use this information in the form ofprice action , indicators andpatternsto guide and inform futuretrendsbefore entering a trade.
This technical analysis beginners guide will introduce you to the basics of this trading approach, and how it can be used to trade the financial markets.
Understanding Technical Analysis
Technical analysis involves the interpretation of patterns from charts. Trader's make use of historic data, based primarily on price and volume and use this information to identify trading opportunities based on common patterns in the market. Different indicators are applied to charts to determineentryandexitpoints for traders to maximize a trades potential at good risk-reward ratios.
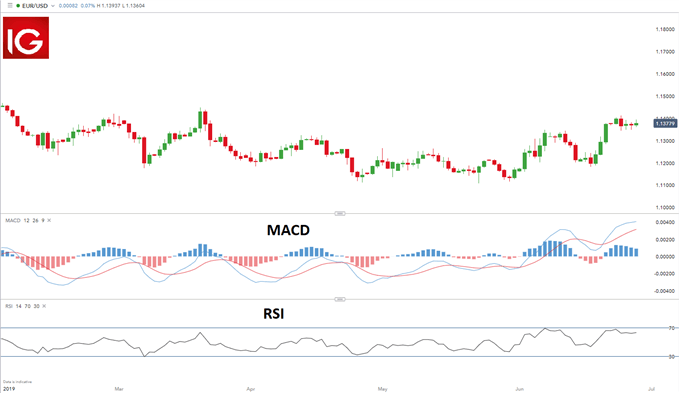
The below chart is an example of a chart with the use of the MACD and RSI indicator.
While advocates offundamental analysisbelieve that economic factors are the main contributors to movements in themarkets, technical analysis traders maintain that past trends can assist in predicting future price movements. Although these trading styles can vary, understanding thedifferences between fundamental and technical analysis– and how to combine them - can be extremely beneficial.
Learn more aboutcombining fundamental and technical analysis
How Technical Analysis can help tradersMany traders have found technical analysis to be a useful tool forrisk-management , which can be a key stumbling block. Once a trader understands the concepts and principles of technical analysis, it can be applied to any market, making it a flexible analytical tool. Where fundamental analysis looks to identify intrinsic value in a market, technical analysis looks to identify trends, which conveniently can be caused by the underlying fundamentals.
Benefits of using technical analysis include the following:
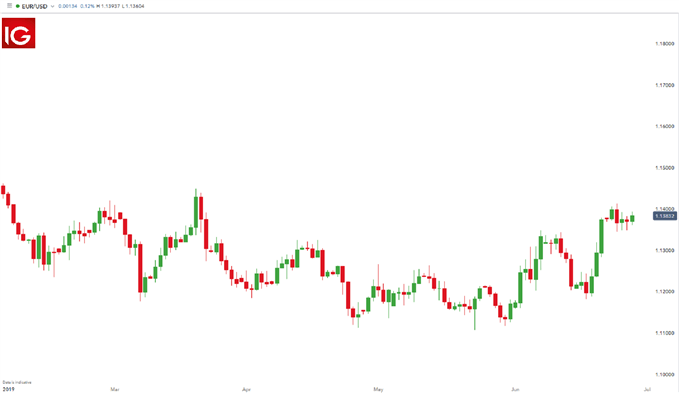
Can be applied to any market using any timeframe Technical analysis can be used as a standalone method Allows traders to identify trends in the market Using Charts in Technical AnalysisThe below chart is an example of a candlestick chart for theEUR/USDcurrency pair.
Charts are key to technical analysis. This is because the most important measure of a market's past and current performance is the price itself; this is the starting point when delving into analyzing the potential of a trade. Price action can be represented on a chart as this is the clearest indication of what the price is doing.
Chartsassist in determining the overall trend, whether there's an upward or downward trend, either over the long or short term or to identifyrange boundconditions. The most commontypes of technical analysis chartsare line charts, bar charts andcandlestick charts .
When using a bar or candlestick chart each period will give the technical analyst information on the price from where it opened, the high or low of the period as well as the close. Candlestick analysis is especially useful as the patterns and relationship within them can assist in making forecasts about the future direction of the price.
Once a trader has mastered thebasics of charting , they can then make use of indicators to assist in determining the trend.
Technical Analysis IndicatorsIndicators are used by technical traders when looking for opportunities in the market. Although many indicators exist, traders often make use of volume and priced-based indicators. These assist in determining where the levels ofsupport and resistance are, how often they are maintained or breached as well ascertaining the length of a trend.
A trader can view the price or any other indicator usingmultiple time frame analysis , ranging from one second to a month which gives the trader a different perspective of the price action.
The more popular indicators for technical analysis include:
Moving Averages Relative strength index (RSI) Moving average convergence divergence (MACD)TheEUR/USDchart below shows how to make use of different indicators.
Moving averages and MACD are often used to identify trends in the market while the RSI is typically used to determine possible entry and exit points. Indicators assist traders in analyzing the market, validating trade set ups and determining entry points.
Learn More about Technical AnalysisReview the three most commontypes of technical analysis chartsto compare techniques. Bookmark ourtechnical analysis newsfeed to stay up to date with the latest insights on current market trends. Join our in-house experts as they explore the main issues affecting trades in the live dailywebinars . Look at what makes a trader successful in theTraits of Successful Tradersmanual. Learn the basics ofForex technical analysisand the benefits of applying it in trading 
Legal Disclaimer:
MENAFN provides the
information “as is” without warranty of any kind. We do not accept
any responsibility or liability for the accuracy, content, images,
videos, licenses, completeness, legality, or reliability of the information
contained in this article. If you have any complaints or copyright
issues related to this article, kindly contact the provider above.
Most popular stories
Market Research

- Global Plant-Based Meat Market Report 2025: Size Projected USD 100.31 Billion, CAGR Of 21.92% By 2033.
- Primexbt Launches Empowering Traders To Succeed Campaign, Leading A New Era Of Trading
- TOKEN2049 Singapore Breaks Records: 25,000 Attendees At The World's Largest Web3 Event
- Japan Well Intervention Market Size To Reach USD 776.0 Million By 2033 CAGR Of 4.50%
- Blackrock Becomes The Second-Largest Shareholder Of Freedom Holding Corp.
- United States Acetic Acid Market Size, Growth & Forecast 2033
More Story


Comments
No comment