Crude Oil Prices Shrug Off Negative News Flow, Gold Eyeing ISM
ignore negative news flow, mount corrective upswing may extend tepid recovery if ISM survey data disappoints See our guide to learn what are the Crude oil prices marched steadily higher, shrugging off news that Exxon Mobile plans to triple its US oil production by 2025 and an IEA forecast predicting slowing demand in 2018. News wires linked the move to EIA data showing a surprise drop in gasoline inventories, but that seems implausible. The same report showed a massive crude storage build however, plus the rally started hours before the figures hit the wires.
Indeed, raw-material stocks added a hefty 6.78 million barrels last week, marking the largest inflow since early March 2017. It seems like a more plausible explanation for the upswing is a retracement driven by shorter-term, opportunistic capital flows triggered after prices dropped to the lowest level in over a week and .Gold prices edged up as the retreated following an underwhelming State of the Union speech from President Donald Trump. A slightly hawkish policy statement but failed to translate into substantive losses for the yellow metal, with corrective flows following the preceding days' losses probably tipping the scales.
The US manufacturing ISM survey is now in focus. Expectations point to a slowdown in factory-sector activity. A recent run of disappointments in realized data outcomes relative to forecasts warns that analysts' models may be too rosy, opening the door for an even grimmer outcome. If this cools Fed rate hike bets, gold may have scope for further gains.Find out here what hint about the price trend!
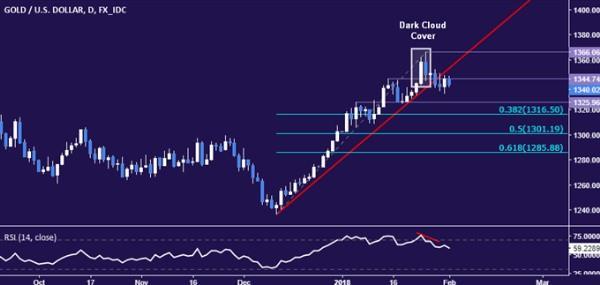
GOLD TECHNICAL ANALYSIS Gold prices continue to languish in consolidation mode but a registered earlier in the week remains intact. Near-term support is inthe 11316.50-25.96 area (January 4 high, 38.2% Fibonacci retracement), with a daily close below that exposing the 50% level at 1301.19.Alternatively, a turn back above 1344.74-53.79 (support-turned-resistance, trend line) paves the way for another challenge of the January 25 high at 1366.06.Chart created using TradingView
CRUDE OIL TECHNICAL ANALYSIS Crude oil prices are attempting to launch a rebound after funding support above the $63/bbl figure. A daily close above support-turned-resistance in the 64.15-65.12 area (January 15 high, 23.6% Fib) opens the door for a retest of the January 25 highat 66.63. Alternatively, a turn back below the January 31 low at 63.64 exposes the 38.2% Fibonacci retracement at 62.62.
Chart created using TradingView
--- Written by Ilya Spivak, Currency Strategist for DailyFX.comTo receive Ilya's analysis directly via email, please
Contact and follow Ilya on Twitter:

Legal Disclaimer:
MENAFN provides the
information “as is” without warranty of any kind. We do not accept
any responsibility or liability for the accuracy, content, images,
videos, licenses, completeness, legality, or reliability of the information
contained in this article. If you have any complaints or copyright
issues related to this article, kindly contact the provider above.


Comments
No comment