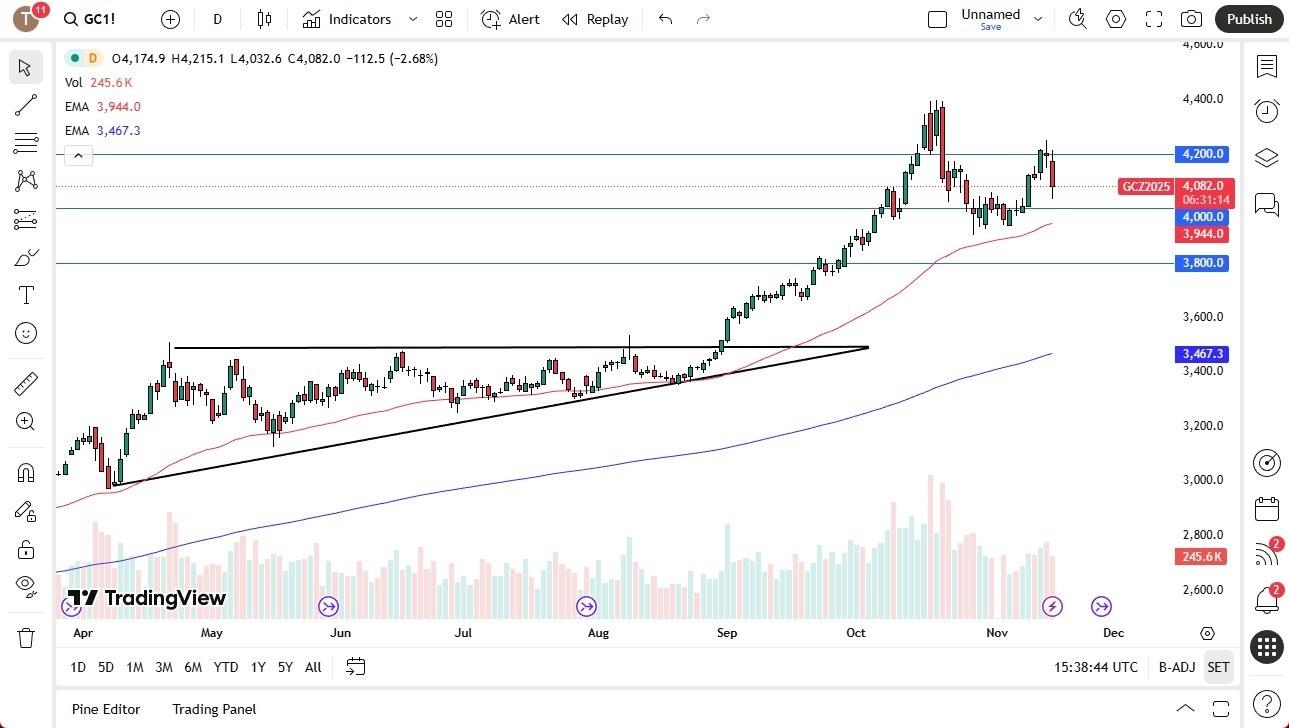
Gold Forecast 17/11: Looking Suspicious (Chart)
- Gold attempted to recover from a gap lower but quickly reversed at $4,200, producing a weak candlestick. Easing trade concerns and fading volume on recent rallies raise questions about momentum and the durability of gold's uptrend.
What I find very interesting on the gold chart is that we spiked and then sold off viciously a couple of weeks ago. But on this return rally to try to take the market to fresh new highs, we haven't had anywhere near the volume. And that is a bit of divergence when it comes to volume. So, it's a classic topping signal. That doesn't mean that you should be short of gold quite yet. But I do think gold isn't the one-way bet it once was.
EURUSD Chart by TradingViewSo, the question becomes, are you going to see the market go sideways and consolidate in order to be comfortable up here? Or are we going to blow through significant support near the 50-day EMA? If we were to break down below the 50-day EMA, we could very well see this market fall apart.If we break above the top of the candlestick from Thursday, that opens up the possibility of a move to the $4,400 level, but that seems to be swimming upstream at the moment.Ready to trade our Gold daily analysis and predictions? We've made a list of the best Gold trading platforms worth trading with.
Legal Disclaimer:
MENAFN provides the
information “as is” without warranty of any kind. We do not accept
any responsibility or liability for the accuracy, content, images,
videos, licenses, completeness, legality, or reliability of the information
contained in this article. If you have any complaints or copyright
issues related to this article, kindly contact the provider above.


Comments
No comment