403
Sorry!!
Error! We're sorry, but the page you were looking for doesn't exist.
GBP/USD Forex Signal 27/10: Bearish Outlook Ahead (Chart)
(MENAFN- Daily Forex) Bearish view
- Sell the GBP/USD pair and set a take-profit at 1.3200. Add a stop-loss at 1.3400. Timeline: 1-2 days.
- Buy the GBP/USD pair and set a take-profit at 1.3400. Add a stop-loss at 1.3200.
The GBP/USD pair will also react to the upcoming talks between Donald Trump and Xi Jinping. The two leaders will aim to provide more clarity and reduce trade tensions.
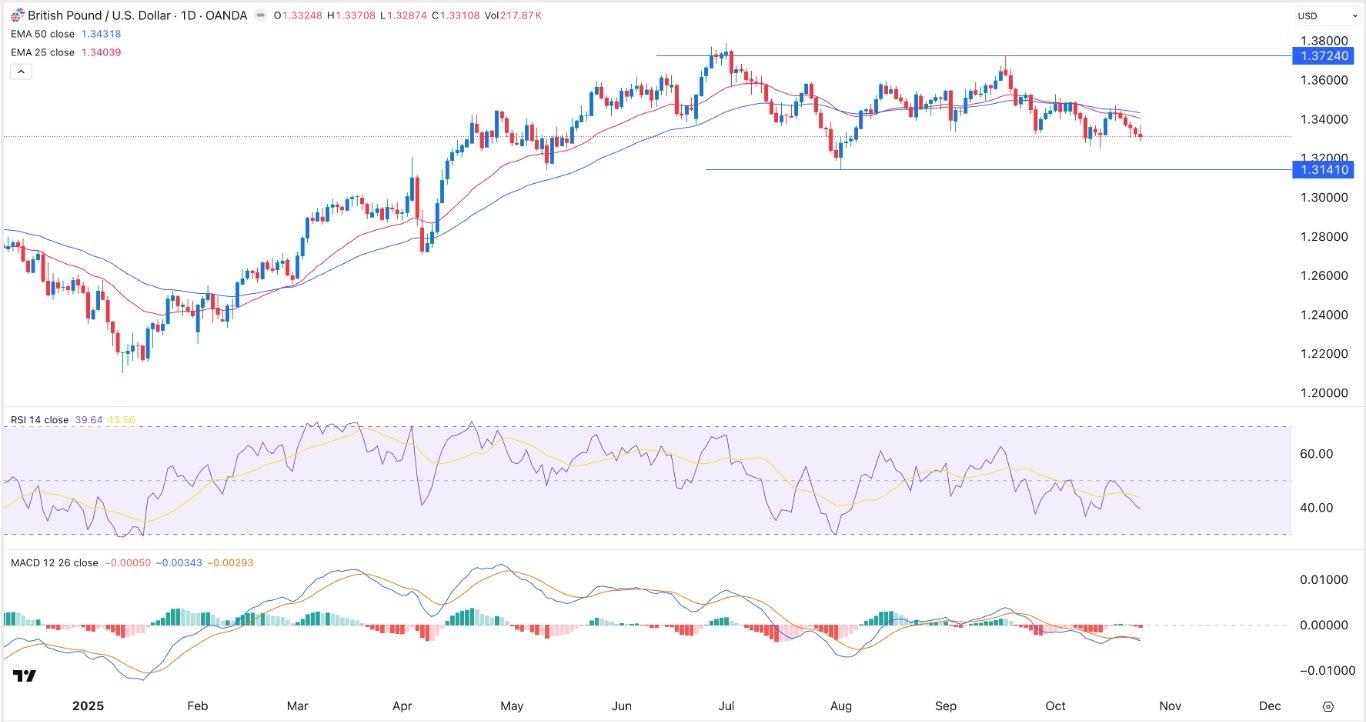
EURUSD Chart by TradingViewGBP/USD Technical AnalysisThe daily chart shows that the GBP/USD pair has pulled back from the September high of 1.3725 to the current 1.3310. It formed a double-top pattern at 1.3725 and a neckline at 1.3141.The pair has moved below the 50-day and 25-day Exponential Moving Averages. It has also moved below the Supertrend indicator, a sign that the bearish trend is continuing.The Relative Strength Index and the MACD have continued falling. Therefore, the pair will likely continue falling as sellers target the key support at 1.3141. A move above the 25-day moving average at 1.3400 will invalidate the bearish view.Ready to trade our free trading signals? We've made a list of the best UK forex brokers worth using.
Legal Disclaimer:
MENAFN provides the
information “as is” without warranty of any kind. We do not accept
any responsibility or liability for the accuracy, content, images,
videos, licenses, completeness, legality, or reliability of the information
contained in this article. If you have any complaints or copyright
issues related to this article, kindly contact the provider above.


Comments
No comment