Tuesday, 02 January 2024 12:17 GMT

GBP/USD Signal 21/10: Ripe For Bearish Breakout (Chart)


(MENAFN- Daily Forex) Bearish view
  • Sell the GBP/USD pair and set a take-profit at 1.3300.
  • Add a stop-loss at 1.3500.
  • Timeline: 1-2 days.
Bullish view
  • Buy the GBP/USD pair and set a take-profit at 1.3500.
  • Add a stop-loss at 1.3300.

The GBP/USD exchange rate wavered on Tuesday morning as investors waited for the upcoming UK and US consumer inflation numbers. Sterling was trading at 1.3412 against the US dollar, a few points below last week's high of 3463 and US Inflation Data Ahead

The GBP/USD pair held in a tight range ahead of Wednesday's Consumer Price Index (CPI) data from the UK. Economists polled by Reuters expect the data to show that the headline CPI rose from 3.8% in August to 4% in September.

Core inflation, which excludes the volatile food and energy prices, is expected to move from 3.6% to 3.7%, while the Retail Price Index is expected to come in at 4.7%.

If these estimates are accurate, they will confirm the fact that the UK economy is in a stagflation, a period consisting of high inflation and slow economic growth. A report released last week showed that the economic growth has largely stalled.

Top Forex Brokers1 Get Started 74% of retail CFD accounts lose money

Therefore, these numbers mean that it will be difficult for the Bank of England to cut interest rates in the upcoming meeting in November. While cutting rates would help to boost economic growth, it would ensure that inflation remains substantially higher for longer.

The GBP/USD pair will also react to the upcoming US inflation report on Friday. Like in the UK, analysts expect the report by the Bureau of Labor Statistics to show that inflation continued rising in September because of Donald Trump's tariffs.

It is still unclear whether these numbers will influence the next interest rate decision by the Federal Reserve. Officials, including Jerome Powell, have hinted that they will cut interest rates next week, citing the weakening labor market.

The GBP/USD exchange rate will also react to the upcoming US and China talks, which will come a week before Trump and Xi Jinping meet in South Korea.

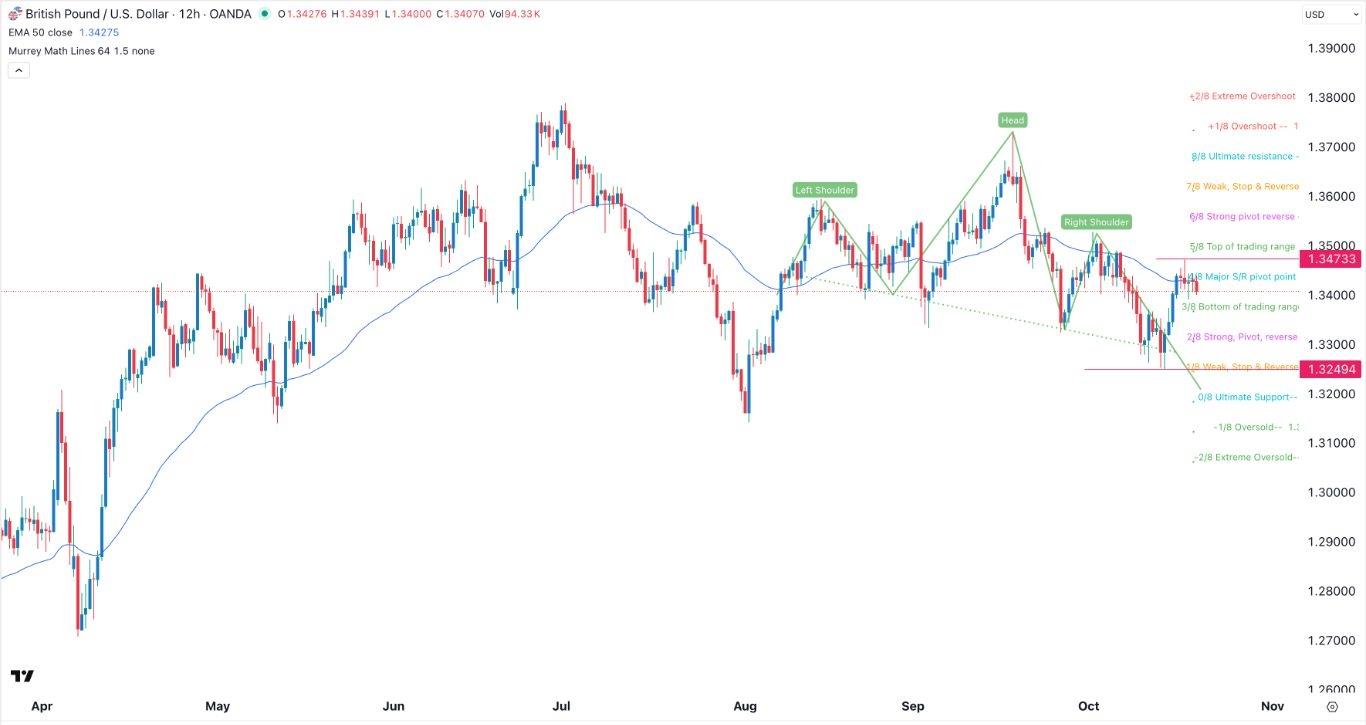
EURUSD Chart by TradingViewGBP/USD Technical Analysis

The 12-hour chart shows that the GBP/USD exchange rate has pulled back in the past few days, moving from a high of 1.3473 to 1.3400. It has found substantial resistance at the 50-period Exponential Moving Average (EMA).

The pair has also formed a head-and-shoulders pattern, which is a common bearish reversal sign. It remains slightly below the Major S/R pivot point of the Murrey Math Lines tool.

Therefore, the pair will likely continue falling as sellers target this month's low of 1.3250. A move above last week's high of 1.3473 will invalidate the bearish outlook.

Ready to trade our daily Forex signal? Check out the best forex brokers in the UK worth using.

MENAFN21102025000131011023ID1110227899


Legal Disclaimer:
MENAFN provides the information “as is” without warranty of any kind. We do not accept any responsibility or liability for the accuracy, content, images, videos, licenses, completeness, legality, or reliability of the information contained in this article. If you have any complaints or copyright issues related to this article, kindly contact the provider above.