Tuesday, 02 January 2024 12:17 GMT

GBP/USD Forex Signal 15/09: Bullish Forecast Ahead (Chart)


(MENAFN- Daily Forex) Bullish view
  • Buy the GBP/USD pair and set a take-profit at 1.3700.
  • Add a stop-loss at 1.3435.
  • Timeline: 1-2 days.
Bearish view
  • Sell the GBP/USD pair and set a take-profit at 1.3435.
  • Add a stop-loss at 1.3700.

The GBP/USD pair was flat on Monday morning as traders waited for important macro data from the United States and the UK, and their respective interest rate decisions. It was trading at 1.3560, up by over 2% from the lowest level in August Data and Interest Rate Decisions

The GBP/USD exchange rate will likely be the most volatile this week because of the important events from the US and the UK. The first one will come from the UK, where the Office of National Statistics (BLS) will publish the latest jobs numbers on Tuesday.

Economists expect the report to show that the jobless rate remained unchanged at 4.7% in July as wages slowed from 5% in June to 4.7% in July.

The office will next publish the latest consumer and producer inflation report on Wednesday and the retail sales on Friday. The most important catalyst for the GBP/USD pair from the UK will be Thursday's central bank decision.

Top Forex Brokers1 Get Started 74% of retail CFD accounts lose money

Economists expect the central bank to leave interest rates unchanged because of the stubbornly high inflation rate. In this case, the average estimate is that the headline consumer inflation slowed from 3.8% in July to 3.7%, much higher than the bank's target of 2.0%.

Meanwhile, the first catalyst from the United States will be the August retail sales numbers, which will provide more information about the health of the economy.

While important, the main driver for the pair will come out on Wednesday when the Federal Reserve publishes the latest monetary policy decision. Economists expect the bank to cut interest rates by 0.25%, in its first move this year.

Morgan Stanley analysts see the bank delivering two more cuts later this year as the economy softens, with the labour market stalling.

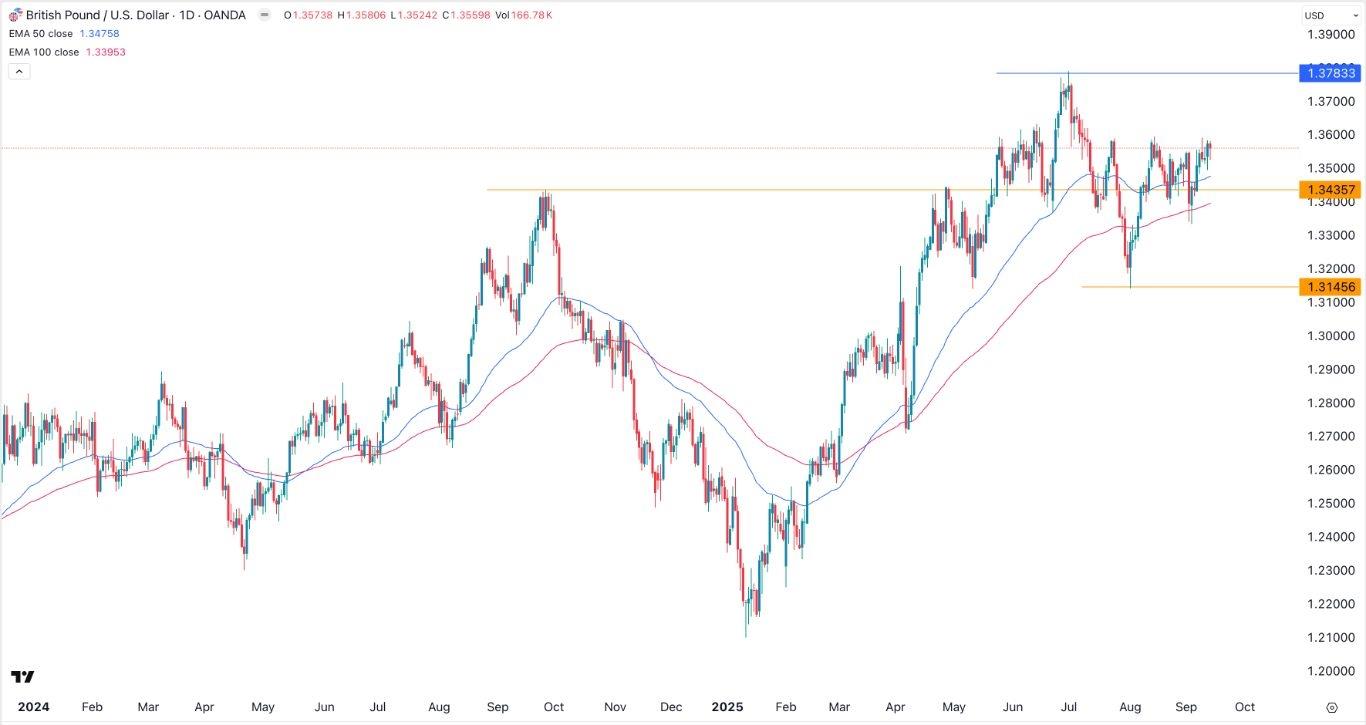
EURUSD Chart by TradingViewGBP/USD Technical Analysis

The daily timeframe chart shows that the GBP/USD pair has rebounded after bottoming at 1.3145 in August as the US dollar index softened. It recently moved above the important resistance level at 1.3435, its highest point in September last year.

The pair has formed an inverse head-and-shoulders pattern and moved above the 50-day and 100-day moving averages. Therefore, sterling will likely continue rising as bulls target the year-to-date high of 1.3783, its highest point on July 3rd. A drop below the support at 1.3435 will invalidate the bullish view.

Ready to trade our free trading signals ? We've made a list of the best UK forex brokers worth using.

MENAFN15092025000131011023ID1110061269

Legal Disclaimer:
MENAFN provides the information “as is” without warranty of any kind. We do not accept any responsibility or liability for the accuracy, content, images, videos, licenses, completeness, legality, or reliability of the information contained in this article. If you have any complaints or copyright issues related to this article, kindly contact the provider above.

Search