


Ceva, Inc. Announces Second Quarter 2025 Financial Results
| Ceva, Inc. AND ITS SUBSIDIARIES |
||||
| INTERIM CONDENSED CONSOLIDATED STATEMENTS OF LOSS – U.S. GAAP |
||||
| U.S. dollars in thousands, except per share data |
||||
| |
||||
| |
Three months ended |
Six months ended |
||
| |
June 30, |
June 30, |
||
| |
2025 |
2024 |
2025 |
2024 |
| |
Unaudited |
Unaudited |
Unaudited |
Unaudited |
| Revenues: |
|
|
|
|
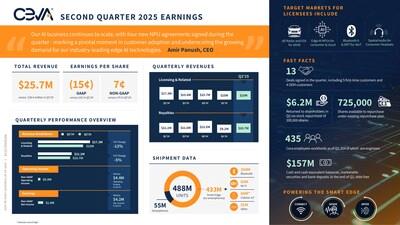
| Licensing and related revenues |
$ 15,022 |
$ 17,278 |
$ 30,064 |
$ 28,692 |
| Royalties |
10,656 |
11,159 |
19,859 |
21,817 |
| |
|
|
|
|
| Total revenues |
25,678 |
28,437 |
49,923 |
50,509 |
| |
|
|
|
|
| Cost of revenues |
3,549 |
2,933 |
7,036 |
5,436 |
| |
|
|
|
|
| Gross profit |
22,129 |
25,504 |
42,887 |
45,073 |
| |
|
|
|
|
| Operating expenses: |
|
|
|
|
| Research and development, net |
18,758 |
18,758 |
36,367 |
36,749 |
| Sales and marketing |
3,322 |
3,095 |
6,771 |
5,911 |
| General and administrative |
4,381 |
3,537 |
8,314 |
7,109 |
| Amortization of intangible assets |
150 |
149 |
299 |
299 |
| Total operating expenses |
26,611 |
25,539 |
51,751 |
50,068 |
| |
|
|
|
|
| Operating loss |
(4,482) |
(35) |
(8,864) |
(4,995) |
| Financial income, net |
2,121 |
1,406 |
4,221 |
2,663 |
| Revaluation of marketable equity securities |
(208) |
(58) |
(262) |
(118) |
| |
|
|
|
|
| Income (loss) before taxes on income |
(2,569) |
1,313 |
(4,905) |
(2,450) |
| Income tax expense |
1,135 |
1,604 |
2,126 |
3,289 |
| Net loss |
$ (3,704) |
$ (291) |
$ (7,031) |
$ (5,739) |
| |
|
|
|
|
| Basic and diluted net loss per share |
$ (0.15) |
$ (0.01) |
$ (0.30) |
$ (0.24) |
| |
|
|
|
|
| Weighted-average shares used to compute net loss per share (in thousands): |
|
|
|
|
| Basic and diluted |
23,898 |
23,628 |
23,832 |
23,568 |
| |
||||
| Unaudited Reconciliation of GAAP to Non-GAAP Financial Measures |
||||
| U.S. Dollars in thousands, except per share amounts |
||||
| |
||||
| |
||||
| |
Three months ended |
Six months ended |
||
| |
June 30, |
June 30, |
||
| |
2025 |
2024 |
2025 |
2024 |
| |
Unaudited |
Unaudited |
Unaudited |
Unaudited |
| GAAP net loss |
$ (3,704) |
$ (291) |
$ (7,031) |
$ (5,739) |
| Equity-based compensation expense included in cost of revenues |
166 |
191 |
325 |
394 |
| Equity-based compensation expense included in research and development expenses |
2,673 |
2,438 |
5,139 |
4,445 |
| Equity-based compensation expense included in sales and marketing expenses |
598 |
451 |
1,164 |
816 |
| Equity-based compensation expense included in general and administrative expenses |
1,465 |
820 |
2,597 |
1,816 |
| Amortization of intangible assets related to acquisition of businesses |
209 |
278 |
417 |
556 |
| Costs associated with asset acquisition |
144 |
252 |
288 |
532 |
| Loss associated with the remeasurement of marketable equity securities |
208 |
58 |
262 |
118 |
| Non-GAAP net income |
$ 1,759 |
$ 4,197 |
$ 3,161 |
$ 2,938 |
| GAAP weighted-average number of Common Stock used in computation of diluted net loss and loss per share (in thousands) |
23,898 |
23,628 |
23,832 |
23,568 |
| Weighted-average number of shares related to outstanding stock-based awards (in thousands) |
1,763 |
1,482 |
1,690 |
1,421 |
| Weighted-average number of Common Stock used in computation of diluted earnings per share, excluding the above (in thousands) |
25,661 |
25,110 |
25,522 |
24,989 |
| |
|
|
|
|
| |
|
|
|
|
| GAAP diluted loss per share |
$ (0.15) |
$ (0.01) |
$ (0.30) |
$ (0.24) |
| Equity-based compensation expense |
$ 0.19 |
$ 0.16 |
$ 0.38 |
$ 0.32 |
| Amortization of intangible assets related to acquisition of businesses |
$ 0.01 |
$ 0.01 |
$ 0.02 |
$ 0.02 |
| Costs associated with asset acquisition |
$ 0.01 |
$ 0.01 |
$ 0.01 |
$ 0.02 |
| Loss associated with the remeasurement of marketable equity securities |
$ 0.01 |
$ 0.00 |
$ 0.01 |
$ 0.00 |
| Non-GAAP diluted earnings per share |
$ 0.07 |
$ 0.17 |
$ 0.12 |
$ 0.12 |
| |
|
|
| |
Three months ended |
Six months ended |
||
| |
June 30, |
June 30, |
||
| |
2025 |
2024 |
2025 |
2024 |
| |
Unaudited |
Unaudited |
Unaudited |
Unaudited |
| GAAP Operating loss |
$ (4,482) |
$ (35) |
$ (8,864) |
$ (4,995) |
| Equity-based compensation expense included in cost of revenues |
166 |
191 |
325 |
394 |
| Equity-based compensation expense included in research and development expenses |
2,673 |
2,438 |
5,139 |
4,445 |
| Equity-based compensation expense included in sales and marketing expenses |
598 |
451 |
1,164 |
816 |
| Equity-based compensation expense included in general and administrative expenses |
1,465 |
820 |
2,597 |
1,816 |
| Amortization of intangible assets related to acquisition of businesses |
209 |
278 |
417 |
556 |
| Costs associated with asset acquisition |
144 |
252 |
288 |
532 |
| Total non-GAAP Operating Income |
$ 773 |
$ 4,395 |
$ 1,066 |
$ 3,564 |
| |
Three months ended |
Six months ended |
||
| |
June 30, |
June 30, |
||
| |
2025 |
2024 |
2025 |
2024 |
| |
Unaudited |
Unaudited |
Unaudited |
Unaudited |
| |
|
|
|
|
| GAAP Gross Profit |
$ 22,129 |
$ 25,504 |
$ 42,887 |
$ 45,073 |
| GAAP Gross Margin |
86 % |
90 % |
86 % |
89 % |
| |
|
|
|
|
| Equity-based compensation expense included in cost of revenues |
166 |
191 |
325 |
394 |
| Amortization of intangible assets related to acquisition of businesses |
59 |
129 |
118 |
257 |
| Total Non-GAAP Gross profit |
22,354 |
25,824 |
43,330 |
45,724 |
| Non-GAAP Gross Margin |
87 % |
91 % |
87 % |
91 % |
| |
|
|
|
|
| Ceva, Inc. AND ITS SUBSIDIARIES |
|||
| INTERIM CONDENSED CONSOLIDATED BALANCE SHEETS |
|||
| (U.S. Dollars in thousands) |
|||
| |
|||
| |
|
June 30, |
December 31, |
| |
|
2025 |
2024 (*) |
| |
|
Unaudited |
Unaudited |
| ASSETS |
|
|
|
| Current assets: |
|
|
|
| Cash and cash equivalents |
|
$ 29,082 |
$ 18,498 |
| Marketable securities and short-term bank deposits |
|
128,422 |
145,146 |
| Trade receivables, net |
|
11,832 |
15,969 |
| Unbilled receivables |
|
24,851 |
21,240 |
| Prepaid expenses and other current assets |
|
14,621 |
15,488 |
| Total current assets |
|
208,808 |
216,341 |
| Long-term assets: |
|
|
|
| Severance pay fund |
|
7,864 |
7,161 |
| Deferred tax assets, net |
|
1,630 |
1,456 |
| Property and equipment, net |
|
6,484 |
6,877 |
| Operating lease right-of-use assets |
|
4,645 |
5,811 |
| Investment in marketable equity securities |
|
50 |
312 |
| Goodwill |
|
58,308 |
58,308 |
| Intangible assets, net |
|
1,460 |
1,877 |
| Other long-term assets |
|
13,593 |
10,805 |
| Total assets |
|
$ 302,842 |
$ 308,948 |
| |
|
|
|
| LIABILITIES AND STOCKHOLDERS' EQUITY |
|
|
|
| Current liabilities: |
|
|
|
| Trade payables |
|
$ 1,771 |
$ 1,125 |
| Deferred revenues |
|
3,212 |
3,599 |
| Accrued expenses and other payables |
|
17,749 |
23,207 |
| Operating lease liabilities |
|
1,610 |
2,598 |
| Total current liabilities |
|
24,342 |
30,529 |
| Long-term liabilities: |
|
|
|
| Accrued severance pay |
|
8,155 |
7,365 |
| Operating lease liabilities |
|
2,755 |
2,963 |
| Other accrued liabilities |
|
1,698 |
1,535 |
| Total liabilities |
|
36,950 |
42,392 |
| Stockholders' equity: |
|
|
|
| Common stock |
|
24 |
24 |
| Additional paid in-capital |
|
267,743 |
259,891 |
| Treasury stock |
|
(5,874) |
(3,222) |
| Accumulated other comprehensive income (loss) |
|
344 |
(1,330) |
| Retained earnings |
|
3,655 |
11,193 |
| Total stockholders' equity |
|
265,892 |
266,556 |
| Total liabilities and stockholders' equity |
|
$ 302,842 |
$ 308,948 |
| |
| (*) Derived from audited financial statements. |
| |
SOURCE Ceva, Inc.
WANT YOUR COMPANY'S NEWS FEATURED ON PRNEWSWIRE? 440k+Newsrooms &
Influencers 9k+
Digital Media
Outlets 270k+
Journalists
Opted In GET STARTED

Legal Disclaimer:
MENAFN provides the
information “as is” without warranty of any kind. We do not accept
any responsibility or liability for the accuracy, content, images,
videos, licenses, completeness, legality, or reliability of the information
contained in this article. If you have any complaints or copyright
issues related to this article, kindly contact the provider above.
Most popular stories
Market Research

- VANTIR Launches To Transform Prop Trading With Transparency And Trust
- Brazil Edtech Market Size, Share, Trends, And Forecast 2025-2033
- Next Generation Management Corp. (OTC: NGMC) Announces Strategic Shift Toward Digital Commerce Acquisitions
- PLPC-DBTM: Non-Cellular Oncology Immunotherapy With STIPNAM Traceability, Entering A Global Acquisition Window.
- What Is The Growth Rate Of The Europe Baby Food And Infant Formula Market In 2025?
- Permissionless Data Hub Baselight Taps Walrus To Activate Data Value Onchain
More Story


Comments
No comment