


403
Sorry!!
Error! We're sorry, but the page you were looking for doesn't exist.

Unpacking China's Early Export Resilience In Face Of Tariffs
| -0.2% | Direct drag on GDP from change in China-US trade balance |
| Lower than expected |
The first place to look for tariff impacts is China's trade flows with the US.
This story can be neatly split into two chapters in the first half of 2025. The first quarter saw a wave of trade frontloading, when China's exports to the US rose 5% YoY. The second quarter, though, showed the impact of tariffs coming into play, down -23.9% YoY.
Given the tariff timeline, this isn't altogether surprising. After initial hikes of 10% apiece in February and March, the flurry of escalations in April caused new tariffs to peak at 145%. During the 90-day ceasefire, this was dropped to 30%, on top of the existing 20% or so of tariffs previously in place.
In the first half of the year, exports to the US were down -10.7% YoY, or $25.9bn. However, China's retaliation against the US resulted in a -9.2% YoY, or $7.5bn, slump in imports over the same period. As such, China's net exports to the US of $141.7bn in 1H25 have fallen $18.4bn compared with 1H24, denting GDP by approximately 0.2%.
As a proportion of China's total exports, the US has fallen from 14.6% in 2024 to 11.9% in 1H25. This is quite a sharp drop. Yet the trend itself has been in place since the first trade war in 2018, when the US's share of China's exports began falling after peaking at 19% in 2017.
US share of China's total exports continued to shrink in 1H25
External demand from other regions has stayed resilient
Fortunately for Chinese exporters, external demand from other economies has helped offset much of the drag from the US. In 1H25, China's exports saw the fastest growth in the EU, Africa, Vietnam, Hong Kong, Thailand, and India. Although exports to the United States declined by $25.7 billion, this was fully offset by increased exports to other countries. This resulted in a net year-over-year increase of $101.5 bn, or growth of 5.9%.
Comparing China's 1H25 export growth to 2024 export growth:
-
Exports to ASEAN accelerated to 13.0% YoY from 12.0% YoY.
-
The two main bright points were in Thailand and Vietnam, which grew by 22.1% YoY and 19.4% YoY, respectively.
-
Within the region, the acceleration was tied to an uptick in export growth to India (14.0%) and Japan (4.9%), though exports to Korea (-2.5%) continued to slump.
-
Strong exports to Germany (11.9%) and France (8.6%) helped offset slower growth to the Netherlands (3.2%) and Italy (4.5%).
-
Upticks of exports to Nigeria (34.5%) and Egypt (13.9%) helped offset continuingly sluggish exports to South Africa (2.0%).
-
A slowdown of exports to Brazil (-2.1%) and Mexico (-2.1%) were the main culprits dragging Latin American exports.

China's re-exports could come under increasing pressure
The importance of re-exports to China's relative export resilience is worth exploring. Re-exports have played a role in helping businesses circumvent tariffs since 2018. Increasingly, these will be under more pressure as the Trump administration hikes tariffs on other regions and includes special clauses specifically targeting re-exports via transshipments.
There's limited research on the scale of China's re-exports. Other than notable port economies such as Hong Kong and Singapore, few countries publish such data. Generally speaking, higher margin categories may be more suitable for re-exports, as products with very thin margins may be unable to absorb the extra costs incurred.
However, looking at specific country data and drawing upon some assumptions, we can make some key inferences. We will primarily focus on Vietnam and Mexico as our case studies for this report.
Cracking down on Vietnam re-exports could have significant implicationsVietnam has been in focus as one of China's main re-export channels and a notable destination for Chinese outward direct investment in manufacturing.
Between 2017 and 2024, China's exports to Vietnam rose from $72.4bn to $162.3bn. In this timeframe, Vietnam's share of China's total exports rose from 3.2% to 4.5%.
Reports on Vietnam's trade deal framework with the US drew attention in China, particularly the special clause adding a higher 40% tariff rate on transshipments. Given the grey area in identifying transshipments and no official data on this front, we can instead look at changes in China's exports to Vietnam and Vietnam's exports to the US between 2017 (prior to the first trade war) and 2024.
Digging through industry-level data, the most striking change was in machinery equipment and electrical products.
-
In 2017, China's exports of machinery and electrical equipment to Vietnam were $26.9bn and accounted for approximately 16.6% of China's total exports to Vietnam. By 2024, this had almost tripled to $77.2bn and represented 47.6% of China's total exports to Vietnam.
In 2017, Vietnam's exports of machinery and electrical equipment to the US were $5.9bn and accounted for approximately 5.3% of total exports to the US. By 2024, this had surged to $45.3bn, representing 40.9% of Vietnam's total exports to the US.
In essence, China's machinery and electrical equipment exports to Vietnam rose around $50bn while Vietnam's similar exports to the US rose just under $40bn. While certainly some of this change could be attributed to Vietnam's own domestic production and demand, it's likely that the rapid surge reflects significant transshipment activity.
Machinery and electrical equipment have likely been a major re-export category through Vietnam
Mexico as a re-export channel could also be impacted by tariff hikes
Mexico is commonly discussed as another re-export channel for China, given its proximity to the US and the previous advantages of the NAFTA and USMCA.
Between 2017 and 2024, China's exports to Mexico rose from $35.9bn to $90.2bn. In the same timeframe, Mexico's share of China's total exports rose from 1.6% to 2.5%.
-
Looking at the similar machinery and electrical equipment categories that we tracked for Vietnam, Mexico doesn't feature the same trends. While exports from this category to Mexico rose 145% from 2017 to 2024, this was in line with broader trends, staying around 44-45% of total exports.
We did, however, see a bit of a shift in autos and auto parts, which more than tripled from 2017 to reach $12.3bn by 2024, and rising from 7.7% of total exports to 13.6%.
-
With growth continuing at 9.3% YoY ytd in 1H25, this may be more tied to Mexico's own domestic demand or auto parts used in Mexico's supply chain rather than direct re-exports. In any case, China's auto exports to Mexico are relatively minor compared to Mexico's total auto exports ($194bn in 2024).
Unlike Vietnam, which has continued to be a source of rapid export growth for China, shipments to Mexico have slowed to -2.1% YoY year to date. It's possible that some re-exports may have slowed after Mexico was hit with high tariffs. Mexico's overall import growth was up around 4% YoY through the first five months of 2025, though sector-level trade data doesn't let us draw any strong conclusions.
Fewer obvious signs of re-export concentration in Mexico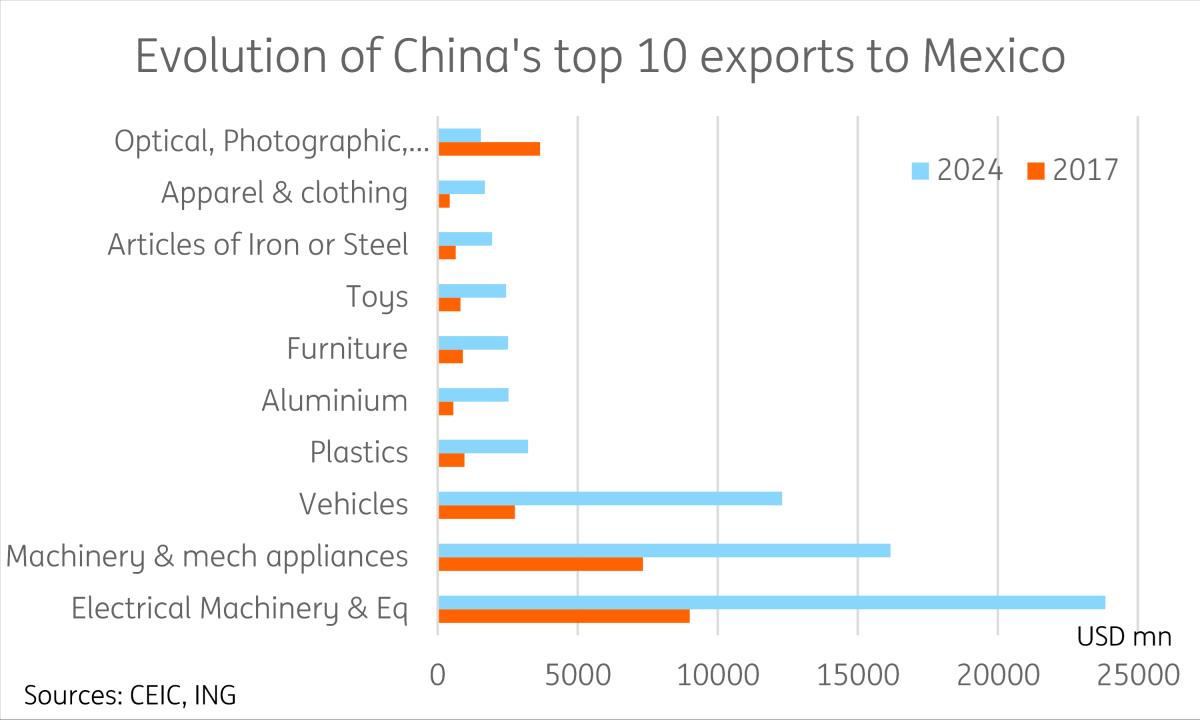
High-value added exports have generally outperformed in the tariff environment
We've seen a high level of divergence in the export growth for different products.
Unsurprisingly, China's recent dominance of the electric vehicle market continued to translate in the related categories, with rapid growth in lithium-ion battery (25.1%) and electric vehicle (21.9%) exports for 1H25. Machine parts (17.7%) and semiconductors (18.0%) have also fared well, given the difficulty of sourcing replacement products.
On the flip side, we see some generally lower value-added sectors under heavier pressure so far this year. Footwear (-7.6%), furniture (-7.3%), and toys (-2.8%) are among the categories in negative YoY growth, likely due to the drag from the US. We saw export growth to the US of these respective categories at -18.9%, -13.8%, and -2.8%.
The tariff environment also has varying levels of influence on each category. While in certain cases it's a major determinant, in other categories the impact is relatively negligible. We take a look at two case studies -- furniture and autos -- to illustrate this in greater depth.
Fast growing export products are relatively insulated from US tariffs
Furniture exports have been an early victim of tariffs
Furniture exports have been one of the underperformers year-to-date, with a year-on-year decline of -5.0% in 1H25. This can be attributed to a steep -13.8% YoY drop of exports to the US. The US is China's largest export destination for furniture, representing around 25% of total mainland furniture exports in 2024.
While furniture products can vary significantly in terms of value added, China's furniture exports tend to compete on the cheaper and lower-value-added side, and have proven to be vulnerable to tariff impacts.
We saw a similar -17.1% drop of China's furniture exports to the US in 2019, when China's furniture exports were hit with a 10-25% tariff. Yet China's overall furniture exports still managed 3.8% YoY growth on the year.
The key differences between the first trade war and the current environment lie in a falloff of demand to the EU and ASEAN, which could partially be explained by reduced re-exports and supply chain shift.
-
During 2019, despite the sharp decline in direct exports to the US, China's furniture exports to East Asia (Japan (3.7%), Korea (15.3%), ASEAN (42.2%), and the EU (9.0%) accelerated and offset the drag.
Vietnam likely served as a major re-export hub for Chinese furniture companies in the first trade war. China's furniture exports to Vietnam surged 51.4% YoY growth in 2019, coinciding with Vietnam's own furniture exports to the US surging 41.3% YoY. In 2018, Vietnam accounted for only 7.6% of total US furniture imports. This figure rose to 19.8% by 2024. As far, as Chinese furnituremakers are concerned, the story in Vietnam could be shifting from re-exports to reshoring, as Vietnam's domestic furniture manufacturing has grown in double digits in recent years.
However, this pattern did not repeat in 1H 2025. China's furniture exports to non-US destinations have also been soft year-to-date, including notable contractions in ASEAN (-1.1%) and EU (-1.4%). With EU's final anti-dumping ruling in July against multilayered wood flooring originating from China, the contraction in furniture exports could worsen in the coming months.
Tariff shock echoed 2019, but this time other regions did not pick up the slack
Tariffs play a limited role in auto export slowdown
China's automobile exports grew by 8.1% YoY in 1H25. This outperformed headline growth, but it's nonetheless notably slower compared to the past few years, when growth was in double or even triple digits.
First, it should be noted that the scale of auto exports has increased over sevenfold from $15.7bn in 2020 to $117.4bn in 2024. As such, it now takes a lot more to maintain a rapid growth rate.
Second, at this stage, the most significant auto tariffs are from the US and the EU, which impose 100% and 27.4-48.1%, respectively, on China EVs.
While a -32.3% YoY drop of auto exports to the US in 1H25 certainly suggests a shock, the US is not a major destination for China's car exports, representing just 2.1% of total auto exports in 2024. For EVs in particular, a combination of exorbitant tariffs and security-related restrictions represents a de facto embargo on EV imports. We didn't see a single BYD on the road in our trip across the country in June.
The EU, on the other hand, is a more sizeable market, with the EU 27 representing around 14.6% of China's total auto exports in 2024. Auto exports to the EU 27 fell by -5.2% YoY in 1H25, led by a slowdown from major importers such as Belgium (-27.4%) and Germany (-19.5%) after tariffs on Chinese EVs rose last October. However, this was not an EU-wide trend. We did see auto exports to Italy (55.1%) and Spain (20.0%) accelerate in 1H25.
While the drop in exports to the EU certainly contributes to the slowdown, the bigger culprit is likely the sharp decline in auto exports to the Russian market. They fell a staggering -65.9% YoY, amounting to around $6bn.
This is likely tied to a broader slowdown in the Russian auto market, with the volume of sales down -23.2% YoY in 1H25. It's likely that this is tied to a policy change from October 2024, when Russia raised its vehicle scrappage fee by 70%–85%. It's a de facto tax on both imported and domestic vehicles collected to fund future disposal and recycling. As a result, Russian importers frontloaded imports before the policy took effect, leading to a reduction in imports this year.
Compared to 2024, the share of the Russian market in China's motor vehicle exports has shrunk significantly-from 18.2% to just 5.2% in 1H25.
Bulk of auto export slowdown could be attributed to Russian demand rather than tariffs
Conclusion: Tariff drag may intensify, but China's export competitiveness should limit the downside
We're already starting to see a clear impact of tariffs across various pockets of trade, as well as noticeable effects on new investment and sentiment. Numerous corporates and investors are taking a a“wait-and-see” stance this year amid continued uncertainty.
That said, the overall impact so far has fallen well short of doom-and-gloom forecasts that prevailed at the start of the year. Through the first half, the direct drag from US trade has been something in the area of -0.2pp on GDP. This has been more than offset by trade with other economies, with total net exports contributing 1.7pp to GDP growth in 1H25. As a result, we've seen the market generally revise China GDP forecasts higher in recent months.
The main question is whether or not China's export resilience can last?
Barring further de-escalation, China's exports will continue to be affected by tariffs. The drag from the US could worsen in 2H25, particularly as we're not seeing another round of frontloading which helped boost exports in 1Q25. The current levels of 50-55% are already quite restrictive and have greatly hindered the price competitiveness of many exports.
We expect China's total export growth to slow further in the second half, but full year export growth should remain in low-to-mid single-digit growth range barring additional shocks.
However, we do see some reasons not to fall into the trap of excessive pessimism.
-
China's fastest-growing exports are not reliant on the US.
-
China's biggest export outperformers over the past year have been ships, semiconductors, and autos. Customs data shows that the exports of these products to the US represented only around 1-2% of China's total in 2024.
Amid China's Great Transition , China's move up the value added ladder has resulted in many Chinese champions producing very competitive products, and even in the case of US tariffs or restrictions, these products will continue to do well in other economies.
-
The biggest monthly YoY decline of China's exports to the US was in May, when growth cratered to -34.5% YoY, but this rebounded to -16.1% YoY in June.
By subcategory, copper products (135.8%), toys (-2.8%), and the optical, photographic, cinematographic, measuring, checking, precision, medical or surgical instruments category (-1.6%) have all fared relatively well in 1H25 despite the major tariff shock.
A wildcard will no doubt be on how the August tariff developments play out. Obviously, the biggest and most direct catalyst will be what happens once the 12 August tariff ceasefire between China and the US is set to end.
Given the unpredictability we've seen so far this year, estimating tariff hikes is a bit of a dart throw. Our base case is that we won't see tariffs reverting back to the April peaks. Following the test of endurance earlier this year, it was clear that such high tariffs are a lose-lose proposition for both parties.
That said, we also cannot rule out tariffs moving higher either, with a further 10% hike well within expectations. With tariffs already at 50-55%, the marginal impact of a further small-scale tariff hike could be relatively manageable. However, as the April episode proved, politics tends to trump economics. A more aggressive than expected re-escalation could lead to a bigger hit to the trade outlook.
Direct tariffs aside, another downside risk in recent months has been other countries signing explicit or implied“anti-China” clauses targeting China's re-exports and foreign entities in their trade deals with the US. The impact will depend on how many economies agree to these clauses, and how strictly they are enforced. This trend certainly represents another downside risk moving forward.
At the same time, the direction of tariffs globally will play a big role in gauging the impact moving forward. The setup of the financial services industry often leads to economists looking at the tariff issue from the perspective of their country alone, with the rest of the world seen as a static variable.
In our view, this can lead to some overestimation of the tariff impact, as seen in the numerous estimates on China's GDP at the start of the year. Arguably, the biggest element when considering the tariff impact is the risk of losing out on exports to competitors via substitution products. If tariffs rise significantly across the board, but not enough to make US-manufactured products viable, this could help mitigate part of the impact compared to if only China and a few other economies are hit. Given the currently speculated tariff rates of 15-20% on most of the key global economies, we could well be seeing this sort of scenario unfold.
An outsized external demand shock was seen as one of the main risk factors for China this year. The resilience of external demand so far is one of the key reasons for China's outperformance in 1H25. We expect exports will likely moderate in the second half of the year, but nonetheless continue to be a growth contributor. This should help China stay on track to reach its growth target of "around 5%" this year.
Author:Lynn Song

Legal Disclaimer:
MENAFN provides the
information “as is” without warranty of any kind. We do not accept
any responsibility or liability for the accuracy, content, images,
videos, licenses, completeness, legality, or reliability of the information
contained in this article. If you have any complaints or copyright
issues related to this article, kindly contact the provider above.
Most popular stories
Market Research

More Story


Comments
No comment