


403
Sorry!!
Error! We're sorry, but the page you were looking for doesn't exist.
How To Use & Trade The Moving Averages Strategy In Forex
(MENAFN- Daily Forex) -content">There are several different types of moving averages and each should be understood before it is used. Almost every charting platform offers all types of moving averages. Note first of all that moving averages can be applied to the closing price, opening price, or the high or low prices of a time series. Typically, they are applied to closing prices, and this is logical as closing prices have great importance, and every opening price is also a closing price or a previous candle. Closing prices have great weight over samples because often it is a level where the price has settled.So, let's look at each type of moving average.The simple moving average (SMA) is just an average of all the periods that it refers to.The exponential moving average (EMA) is calculated by giving greater weight to the most recent value. This means that for example if the price has been flat, but begins to rise, an EMA will be showing a level higher than an SMA covering the same look back period.The linear weighted moving average, which is sometimes referred to as just as a weighted moving average (LWMA or WMA), is like the EMA also calculated by giving more weight to the most recent value, but the weighting is proportionate throughout the data series, whereas the EMA only gives greater weight to the most recent sample.There are a few other types of moving averages. You do not need to worry about them. These three can give you everything you need Moving AveragesThere are a few specific moving averages that are watched by a large number of traders. I'll outline them here, but I suggest not to pay much attention to where the price is in relation to any of them, as if it were something important in itself. These key moving averages are:
candlesticks . In other words, it is the average price over the previous 20 candles, 50 candles, 100 candles, or whatever. The trader can select how many candles they want to look back at. While moving averages can use the open, high, low, or close price of the candlestick, 99.9% of the time you will see people use them applied to the closing prices of these candlesticks.The simple moving average (SMA) is the straightforward moving average calculation that you would expect. In other words, if the 20 SMA is plotted on the chart, it will let you know what the average price was at the closes of the previous 20 candlesticks. As the market advances to generate another candlestick, it will simply adjust the calculation to include only the immediately previous 20 candlesticks, and so on. By taking the average closing prices and adding them, then dividing by 20, the SMA comes up with its calculated value. It then plots the calculation on the chart, drawing a line through all of the dots to form a longer line across the width of the chart.The EMA in Forex trading is the same thing, except the formula is mathematically weighted to put more emphasis on the most recent candlesticks. This causes this type of moving average to be more immediately sensitive to price fluctuations and therefore it will change direction more quickly. Which type of moving average in Forex trading should you use? Most traders use the EMA, but at the end of the day they are used in mostly the same way. Take a look at the chart below and notice the slight difference between the two. The black line is a 20-day Simple Moving Average, while the red is a 20-day Exponential Moving Average.How the EMA is Usually Used in Forex TradingThere are a multitude of uses for the EMA in Forex online trading, and quite frankly your imagination is the only limit as a Measurement of TrendIn its most basic form though, traders tend to use the EMA as a measurement of
trend . In other words, if the moving average is rising over time, then it is assumed that the trend is also very positive. Conversely, if a moving average is drifting lower over time, then the market is thought of as being bearish or negative as Dynamic Support/ResistanceSome traders will use specific EMAs as dynamic support and resistance. This is because there are some very widely followed Exponential Moving Averages. Most of them harken back to the days of stock trading. Some of the most common ones are the 20-day EMA, 50-day EMA, 100-day EMA, and the 200-day EMA. This practice of using these particular round numbers is psychological and goes back to the early years of technical analysis, and therefore it is more or less a convention that anything else. As you continue your online trading career, you will see moving averages that people insist perform better than others, but at the end of the day it is a personal preference issue.
Shorter-term traders
tend to like smaller numbers such as the 9 EMA, because it is so quick to react in comparison to something like the 50 EMA. However, if you are a
longer-term trend trader , then you pay much more attention to higher numbers because it takes much more information and movement to change the direction of those moving averages, thereby keeping you in the trade for much longer periods of time. To see dynamic support and resistance in action, take a look at the chart below:Multiple EMAs as a“Dragon”As you can see in the price chart below, there are multiple EMAs plotted, and you can see just how differently each one reacts to price on the daily chart. In this chart I have plotted the 9, 20, 50, 100, and 200-day EMAs. In fact, some people use this exact type of set up to make sure that they are trading with a multitude of traders as far as the trend is concerned. They will only trade in the direction all moving averages and only when they are all moving in the same manner.EMA Crossover SystemAnother way that people will use the EMA as an indicator is in a“crossover system” as a trading strategy. This is one of the most basic online trading systems out there, and by its very nature needs a trend in order to be profitable. This is done by using two moving averages, one as a short-term moving average and one as a longer-term moving average. In the example in the price chart of the CAD/JPY currency cross shown below, I have the 50-day EMA plotted in red, and the 200-day EMA plotted in black. The idea is that if the shorter moving average, in this case the 50-day EMA, crosses above the 200-day EMA, you should be looking to take long trades. Conversely, if the 50-day EMA crosses below the 200-day EMA, you should be looking to take short trades. Some traders use this as a mechanical system to simply generate trades with no filter whenever the crossover happens. The biggest problem with this of course is that you need a strong trend for it to work, and in a ranging market you will get a lot of
whipsaw
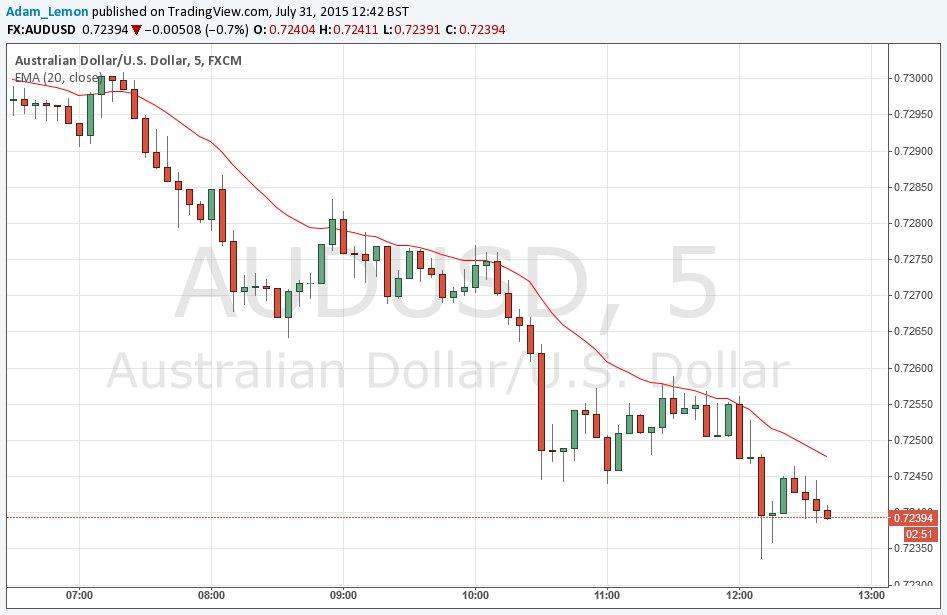
trading, causing repeated small losses, but eventually you get a strong trend and you make larger profits. It takes a certain type of psychology to be able to trade this system over the long term Moving Averages as Momentum IndicatorsOne of the best ways to use moving averages like the professionals do is by using them as momentum indicators, to determine whether there is a trend, and how strong it is. The best edge that retail traders have available to make use of is to trade in the direction of a strong trend, if one exists.One way to do this is to look at the angle of the slope of a moving average. For example, in a strong upwards trend, a lot of traders will be looking at the angle of the 20 EMA. If the angle is strong and consistent, it is indicative of a trend existing. Note how in the chart below, the 20 EMA is showing a reasonably strong angle, and also note that the price has mostly stayed below it all the way back on the chart. This is indicative of a downwards trend.
Moving Average Crosses as Momentum IndicatorsA way to do this that is more sophisticated, is to look at whether a faster moving average is above a slower moving average, and to implement this on multiple time frames. When you have higher time frames showing a good trend but a pull back on the lower time frames, this might give you an opportunity to enter in the direction of the trend when the moving averages cross back in the same direction as the higher time frame or time frames.A combination of moving averages that I like to use is the 3 EMA as a fast moving average and the 10 SMA as a slow moving average. There is nothing especially magic about these numbers – beware of traders who swear by something like the 42 period LWMA as a magic indicator – but the difference between them tends to give you an early alert of a change in direction. In fact, when I use this combination, I do not just use multiple time frames, I need to see the
RSI
10 period indicator agreeing with the direction too.
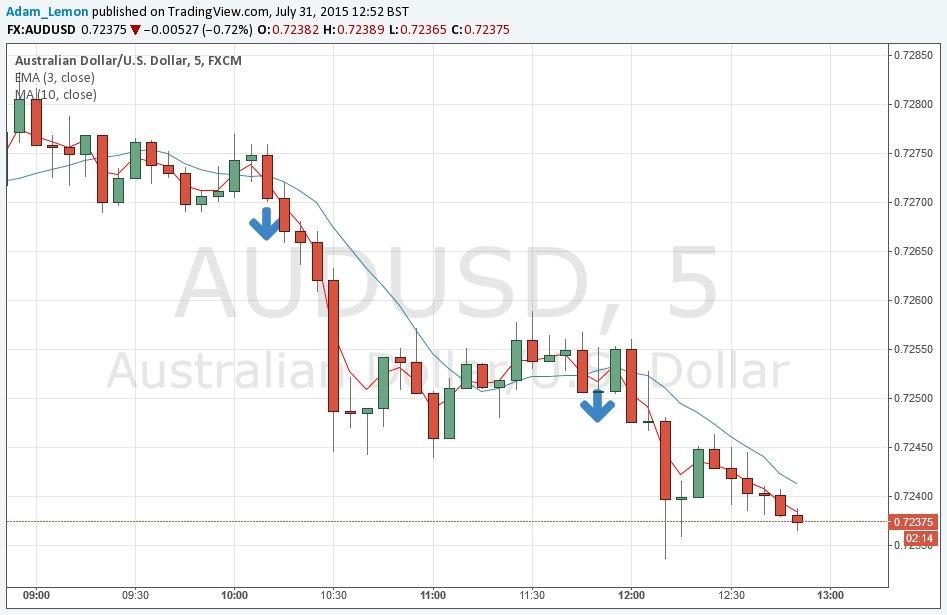
This kind of multiple time frame, multiple moving average strategy can be highly profitable .In the sample chart shown below, these two moving averages on higher time frames are all showing the 3 EMA below the 10 SMA. In this 5 minute chart, while this condition existed within higher time frames, the 3 EMA pulled back twice before crossing back below the 10 SMA as indicated by the downward arrows. These two crosses could both have given profitable short term trades.
Moving Average Crossover SystemThe moving average crossover system is by far the most common way that you will see moving average is used. It's a simple blend of at least two moving averages at different intervals. There is the faster moving average, which is used to determine the short-term trend, and a slower moving average to determine the longer-term trend. The idea is that when the short-term interval moving average crosses above the slower longer-term interval moving average, momentum is building to the upside and buyers will jump in and continue to push higher. Of course, the exact opposite is true as well. If the short-term interval moving average crosses below the longer-term moving average, it's a signal to start selling. As you can see on the chart above, the moving average is crisscrossing three different times. Traders will simply buy and sell every time they get a crossover. Because of this, the trader is always in the market. As a side note, I would point out that you need both moving averages either turning up or down to give a better signal, as this is a trend following system, meaning that you get chopped up in a sideways market as the moving averages can cross back and forth randomly Support or ResistanceMoving averages can also be used to enhance systems to promote
better trading . For example, the
200 day moving average is
often used as a trend finding tool, and also recognized as significant
support or resistance , especially on the daily chart. This is because it represents the 200 working days over the course of a year. If the 200 moving average is turned up, you are looking to buy the asset, and of course the opposite is true. There are also moving average is that people will use quite significantly, including the 50 and the 100 moving average.
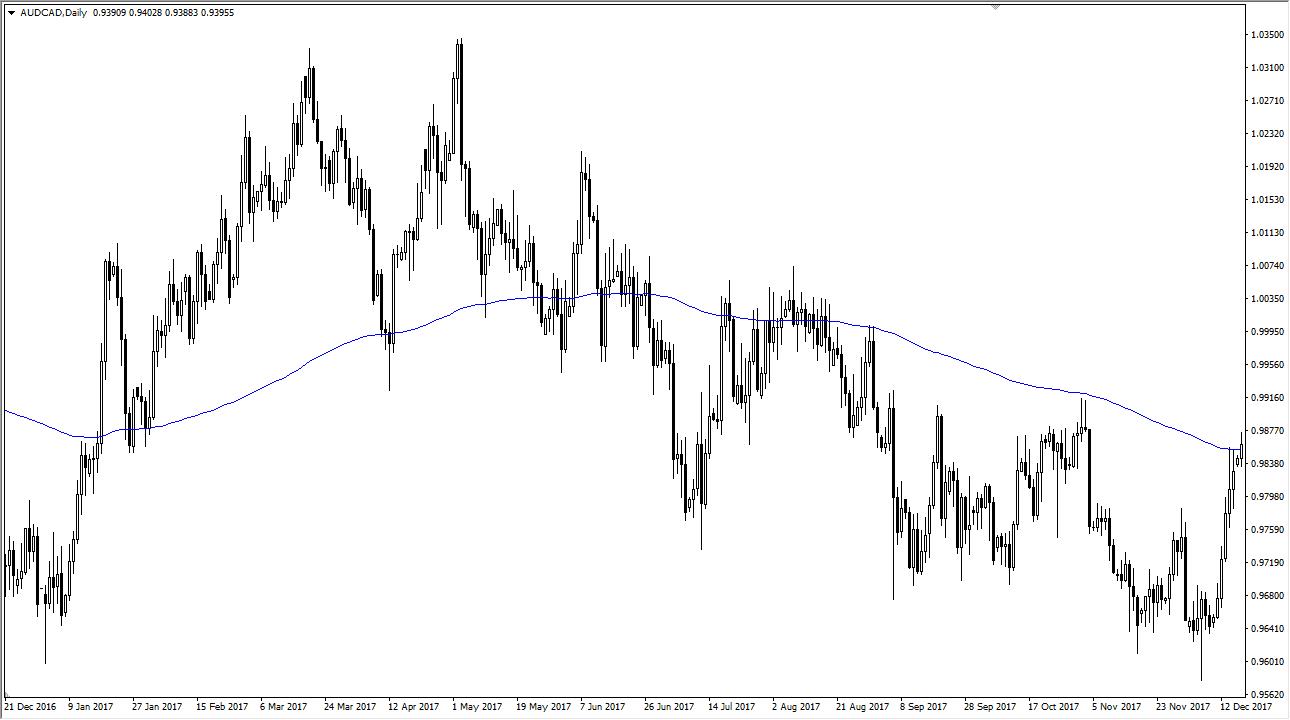
As you can see on the chart above, there has been a reaction to the 200 moving average on the daily chart more than once. However, I would point out that the moving average by itself is typically not a reason to get involved. Most of the time you are looking for a price action along with that moving average to back up your trading decision Benefits of Using a Moving Average Trading StrategySome of the most common trading strategies are profitable because so many other people use them. After all, if it's a simple strategy that pays profits over time, it's attractive to most people. Beyond that, most moving average trading systems are extraordinarily simple, which is very attractive as they allow even newer traders to be involved. Beyond that, moving average systems are very attractive for
algorithmic traders , which will automatically buy or sell at basic averages. This is because of her time it's been shown to be a profitable strategy.Moving averages and the appropriate strategy can keep you in sync with the overall
trend of the markets . This is of course crucial to being a profitable trader over the longer-term. Moving average strategies tend to be somewhat mechanical, so it makes trading much simpler for those who tend to suffer from“paralysis by analysis.”Some of the cons of using a moving average trading strategyAs with all things, there are both pros and cons. Moving average strategies tend to get chopped up and sideways markets as I had mentioned previously, and that is by far one of its greatest weaknesses. Because of this, quite often people will add other indicators such as an oscillator to determine whether or not the crossover is viable. After that, people tend to add far too much to moving average strategies as they don't necessarily have a high profitable rate, but the gains far surpass the losses. That's one of the biggest issues with trading these strategies: the trader needs to be able to trade the system without getting shaken out after a couple of
losses . They simply must trust the longer-term viability of the system, and that is typically difficult for most traders. It takes a lot of psychological wherewithal to hang onto these systems over the longer-term.One of the other major cons of these systems is also they are typically discovered early in your trading career. Those new traders tend to jump from one system to the other, so they won't stay in the same system long enough to realize the gains. This will typically sour them to moving average strategies for the longer-term take on moving average trading strategiesI believe that
moving average
trading strategies do work and they are very good over the longer-term. However, whether the trader can hang onto those trades or not is a completely different story. You must look within yourself to see whether you can handle a lower percentage
win rate . Most traders can't, and that's why these systems get a bit of a bad rap. If you have a lot of patience, the profitability is there and has been for decades. This is why these systems have been a staple for traders over time. The question is whether or not you can handle it from Moving AveragesIt is not appreciated widely enough that almost all trend indicators are based upon some kind of moving averages. For example, the Bollinger Band is just the 20 EMA in the middle with statistical deviation channels based upon the range of historical prices.A very sophisticated way to use a moving average is to scoop up quick, high probability pips by the following method. Say a fairly short-term moving average such as the 20 EMA is showing a strong angle and the price generally holding above it. If the price very suddenly falls by a long way to now be below that moving average, there is a high probability the price will“snap back” quickly to rise back above it.Another variation on this is to look for a candlestick that is not touching the moving averages at all, but is indicating a move back towards the area of the moving averages. For example, in the image above, the 8th
candlestick from the right is an inside doji and is not touching the moving averages at all. This suggests that the price is going to at least pull back a few pips, as it did.
- 20 EMA 50 SMA 100 SMA 200 SMA 200 EMA
candlesticks . In other words, it is the average price over the previous 20 candles, 50 candles, 100 candles, or whatever. The trader can select how many candles they want to look back at. While moving averages can use the open, high, low, or close price of the candlestick, 99.9% of the time you will see people use them applied to the closing prices of these candlesticks.The simple moving average (SMA) is the straightforward moving average calculation that you would expect. In other words, if the 20 SMA is plotted on the chart, it will let you know what the average price was at the closes of the previous 20 candlesticks. As the market advances to generate another candlestick, it will simply adjust the calculation to include only the immediately previous 20 candlesticks, and so on. By taking the average closing prices and adding them, then dividing by 20, the SMA comes up with its calculated value. It then plots the calculation on the chart, drawing a line through all of the dots to form a longer line across the width of the chart.The EMA in Forex trading is the same thing, except the formula is mathematically weighted to put more emphasis on the most recent candlesticks. This causes this type of moving average to be more immediately sensitive to price fluctuations and therefore it will change direction more quickly. Which type of moving average in Forex trading should you use? Most traders use the EMA, but at the end of the day they are used in mostly the same way. Take a look at the chart below and notice the slight difference between the two. The black line is a 20-day Simple Moving Average, while the red is a 20-day Exponential Moving Average.How the EMA is Usually Used in Forex TradingThere are a multitude of uses for the EMA in Forex online trading, and quite frankly your imagination is the only limit as a Measurement of TrendIn its most basic form though, traders tend to use the EMA as a measurement of
trend . In other words, if the moving average is rising over time, then it is assumed that the trend is also very positive. Conversely, if a moving average is drifting lower over time, then the market is thought of as being bearish or negative as Dynamic Support/ResistanceSome traders will use specific EMAs as dynamic support and resistance. This is because there are some very widely followed Exponential Moving Averages. Most of them harken back to the days of stock trading. Some of the most common ones are the 20-day EMA, 50-day EMA, 100-day EMA, and the 200-day EMA. This practice of using these particular round numbers is psychological and goes back to the early years of technical analysis, and therefore it is more or less a convention that anything else. As you continue your online trading career, you will see moving averages that people insist perform better than others, but at the end of the day it is a personal preference issue.
Shorter-term traders
tend to like smaller numbers such as the 9 EMA, because it is so quick to react in comparison to something like the 50 EMA. However, if you are a
longer-term trend trader , then you pay much more attention to higher numbers because it takes much more information and movement to change the direction of those moving averages, thereby keeping you in the trade for much longer periods of time. To see dynamic support and resistance in action, take a look at the chart below:Multiple EMAs as a“Dragon”As you can see in the price chart below, there are multiple EMAs plotted, and you can see just how differently each one reacts to price on the daily chart. In this chart I have plotted the 9, 20, 50, 100, and 200-day EMAs. In fact, some people use this exact type of set up to make sure that they are trading with a multitude of traders as far as the trend is concerned. They will only trade in the direction all moving averages and only when they are all moving in the same manner.EMA Crossover SystemAnother way that people will use the EMA as an indicator is in a“crossover system” as a trading strategy. This is one of the most basic online trading systems out there, and by its very nature needs a trend in order to be profitable. This is done by using two moving averages, one as a short-term moving average and one as a longer-term moving average. In the example in the price chart of the CAD/JPY currency cross shown below, I have the 50-day EMA plotted in red, and the 200-day EMA plotted in black. The idea is that if the shorter moving average, in this case the 50-day EMA, crosses above the 200-day EMA, you should be looking to take long trades. Conversely, if the 50-day EMA crosses below the 200-day EMA, you should be looking to take short trades. Some traders use this as a mechanical system to simply generate trades with no filter whenever the crossover happens. The biggest problem with this of course is that you need a strong trend for it to work, and in a ranging market you will get a lot of
whipsaw
trading, causing repeated small losses, but eventually you get a strong trend and you make larger profits. It takes a certain type of psychology to be able to trade this system over the long term Moving Averages as Momentum IndicatorsOne of the best ways to use moving averages like the professionals do is by using them as momentum indicators, to determine whether there is a trend, and how strong it is. The best edge that retail traders have available to make use of is to trade in the direction of a strong trend, if one exists.One way to do this is to look at the angle of the slope of a moving average. For example, in a strong upwards trend, a lot of traders will be looking at the angle of the 20 EMA. If the angle is strong and consistent, it is indicative of a trend existing. Note how in the chart below, the 20 EMA is showing a reasonably strong angle, and also note that the price has mostly stayed below it all the way back on the chart. This is indicative of a downwards trend.
Moving Average Crosses as Momentum IndicatorsA way to do this that is more sophisticated, is to look at whether a faster moving average is above a slower moving average, and to implement this on multiple time frames. When you have higher time frames showing a good trend but a pull back on the lower time frames, this might give you an opportunity to enter in the direction of the trend when the moving averages cross back in the same direction as the higher time frame or time frames.A combination of moving averages that I like to use is the 3 EMA as a fast moving average and the 10 SMA as a slow moving average. There is nothing especially magic about these numbers – beware of traders who swear by something like the 42 period LWMA as a magic indicator – but the difference between them tends to give you an early alert of a change in direction. In fact, when I use this combination, I do not just use multiple time frames, I need to see the
RSI
10 period indicator agreeing with the direction too.
This kind of multiple time frame, multiple moving average strategy can be highly profitable .In the sample chart shown below, these two moving averages on higher time frames are all showing the 3 EMA below the 10 SMA. In this 5 minute chart, while this condition existed within higher time frames, the 3 EMA pulled back twice before crossing back below the 10 SMA as indicated by the downward arrows. These two crosses could both have given profitable short term trades.
Moving Average Crossover SystemThe moving average crossover system is by far the most common way that you will see moving average is used. It's a simple blend of at least two moving averages at different intervals. There is the faster moving average, which is used to determine the short-term trend, and a slower moving average to determine the longer-term trend. The idea is that when the short-term interval moving average crosses above the slower longer-term interval moving average, momentum is building to the upside and buyers will jump in and continue to push higher. Of course, the exact opposite is true as well. If the short-term interval moving average crosses below the longer-term moving average, it's a signal to start selling. As you can see on the chart above, the moving average is crisscrossing three different times. Traders will simply buy and sell every time they get a crossover. Because of this, the trader is always in the market. As a side note, I would point out that you need both moving averages either turning up or down to give a better signal, as this is a trend following system, meaning that you get chopped up in a sideways market as the moving averages can cross back and forth randomly Support or ResistanceMoving averages can also be used to enhance systems to promote
better trading . For example, the
200 day moving average is
often used as a trend finding tool, and also recognized as significant
support or resistance , especially on the daily chart. This is because it represents the 200 working days over the course of a year. If the 200 moving average is turned up, you are looking to buy the asset, and of course the opposite is true. There are also moving average is that people will use quite significantly, including the 50 and the 100 moving average.
As you can see on the chart above, there has been a reaction to the 200 moving average on the daily chart more than once. However, I would point out that the moving average by itself is typically not a reason to get involved. Most of the time you are looking for a price action along with that moving average to back up your trading decision Benefits of Using a Moving Average Trading StrategySome of the most common trading strategies are profitable because so many other people use them. After all, if it's a simple strategy that pays profits over time, it's attractive to most people. Beyond that, most moving average trading systems are extraordinarily simple, which is very attractive as they allow even newer traders to be involved. Beyond that, moving average systems are very attractive for
algorithmic traders , which will automatically buy or sell at basic averages. This is because of her time it's been shown to be a profitable strategy.Moving averages and the appropriate strategy can keep you in sync with the overall
trend of the markets . This is of course crucial to being a profitable trader over the longer-term. Moving average strategies tend to be somewhat mechanical, so it makes trading much simpler for those who tend to suffer from“paralysis by analysis.”Some of the cons of using a moving average trading strategyAs with all things, there are both pros and cons. Moving average strategies tend to get chopped up and sideways markets as I had mentioned previously, and that is by far one of its greatest weaknesses. Because of this, quite often people will add other indicators such as an oscillator to determine whether or not the crossover is viable. After that, people tend to add far too much to moving average strategies as they don't necessarily have a high profitable rate, but the gains far surpass the losses. That's one of the biggest issues with trading these strategies: the trader needs to be able to trade the system without getting shaken out after a couple of
losses . They simply must trust the longer-term viability of the system, and that is typically difficult for most traders. It takes a lot of psychological wherewithal to hang onto these systems over the longer-term.One of the other major cons of these systems is also they are typically discovered early in your trading career. Those new traders tend to jump from one system to the other, so they won't stay in the same system long enough to realize the gains. This will typically sour them to moving average strategies for the longer-term take on moving average trading strategiesI believe that
moving average
trading strategies do work and they are very good over the longer-term. However, whether the trader can hang onto those trades or not is a completely different story. You must look within yourself to see whether you can handle a lower percentage
win rate . Most traders can't, and that's why these systems get a bit of a bad rap. If you have a lot of patience, the profitability is there and has been for decades. This is why these systems have been a staple for traders over time. The question is whether or not you can handle it from Moving AveragesIt is not appreciated widely enough that almost all trend indicators are based upon some kind of moving averages. For example, the Bollinger Band is just the 20 EMA in the middle with statistical deviation channels based upon the range of historical prices.A very sophisticated way to use a moving average is to scoop up quick, high probability pips by the following method. Say a fairly short-term moving average such as the 20 EMA is showing a strong angle and the price generally holding above it. If the price very suddenly falls by a long way to now be below that moving average, there is a high probability the price will“snap back” quickly to rise back above it.Another variation on this is to look for a candlestick that is not touching the moving averages at all, but is indicating a move back towards the area of the moving averages. For example, in the image above, the 8th
candlestick from the right is an inside doji and is not touching the moving averages at all. This suggests that the price is going to at least pull back a few pips, as it did.

Legal Disclaimer:
MENAFN provides the
information “as is” without warranty of any kind. We do not accept
any responsibility or liability for the accuracy, content, images,
videos, licenses, completeness, legality, or reliability of the information
contained in this article. If you have any complaints or copyright
issues related to this article, kindly contact the provider above.
Most popular stories
Market Research

More Story


Comments
No comment