


403
Sorry!!
Error! We're sorry, but the page you were looking for doesn't exist.
Obsessive-Compulsive Disorder Drugs Market, Rising Prevalence Of OCD To Boost Market Growth - Technavio Research Reports'
(MENAFN- PR Newswire)
Latest market research report titled Obsessive-Compulsive Disorder Drugs Market by Product and Geography - Forecast and Analysis 2022-2026 has been announced by Technavio which is proudly partnering with Fortune 500 companies for over 16 years
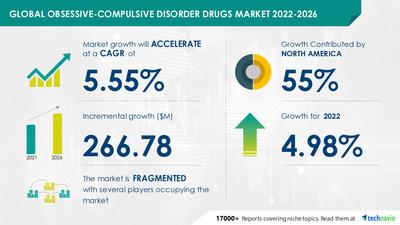
NEW YORK, Aug. 23, 2022 /PRNewswire/ -- The ' Obsessive-Compulsive Disorder Drugs Market ' report has been added to Technavio's offering. With ISO 9001:2015 certification, Technavio is proudly partnering with more than 100 Fortune 500 companies for over 16 years. The potential growth difference for the obsessive-compulsive disorder drugs market between 2021 and 2026 is USD 266.78 million. To get the exact yearly growth variance and the Y-O-Y growth rate, Buy Sample Report.
Obsessive-Compulsive Disorder Drugs Market Driver
Continue ReadingLatest market research report titled Obsessive-Compulsive Disorder Drugs Market by Product and Geography - Forecast and Analysis 2022-2026 has been announced by Technavio which is proudly partnering with Fortune 500 companies for over 16 years
The increased prevalence of OCD is one of the major factors propelling growth in the market for medications treating it. OCD is a mental illness that lasts for a very long time. Due to the significant shift in people's lifestyles, OCD is more common in high-income countries.
For instance, exposure to movie technology causes people to have fictitious visions, intrusive thoughts, and cravings. In high-income nations, OCD is regarded as the fourth most prevalent mental condition. The stages of childhood, adolescence, or early adulthood are when it is most noticeable. Over the projected period, the market is anticipated to be driven by the disorder's high prevalence. Request Free Sample Report.
Obsessive-Compulsive Disorder Drugs Market Challenges
The obsessive-compulsive disorder medications market would face significant obstacles due to the challenges in diagnosing OCD over the forecasted period. OCD is a reasonably prevalent disorder; nevertheless, despite excellent therapy being accessible, doctors frequently underdiagnose and undertreat the condition because it lacks observable symptoms.
Due to the non-disclosure mentality of the patients, the OCD symptoms can differ from person to person. The following are typical challenges faced by doctors while diagnosing OCD. Since many psychiatric disorders have symptoms of OCD, it can be challenging to distinguish between the two conditions. This makes diagnosing OCD difficult. Download Free Sample Report.
Obsessive-Compulsive Disorder Drugs Market Segmentation
The SSRI category will significantly increase its market share for medications used to treat obsessive-compulsive disorder. The segment's expansion is fueled by the wide variety of SSRIs that are readily available on the market, including fluoxetine, fluvoxamine, paroxetine, sertraline, citalopram, and escitalopram.
Due to the huge demand for SSRIs, numerous generic versions have received approval from important nations and organizations like the US, EU, and Japan. SSRI formulations with controlled and prolonged release are being developed by some businesses. During the anticipated time, the market is anticipated to expand due to these new medications.
Obsessive-Compulsive Disorder Drugs Market Geographic Analysis
North America will account for 55% of the market's growth throughout the projection period. Drugs for obsessive-compulsive disorder are primarily sold in the US and Canada in North America. The market in this region will expand more quickly than the markets in ROW and Europe. Obsessive-compulsive disorder pharmaceuticals market expansion in North America over the forecast period would be aided by the rising prevalence of OCD, government measures to address OCD, and the availability of medications.
Related Reports
Celiac Diseases Drugs Market by Therapy Type and Geography - Forecast and Analysis 2022-2026: The celiac diseases drugs market share is expected to increase by USD 601.57 million from 2021 to 2026, and the market's growth momentum will accelerate at a CAGR of 16.95%.
Erythropoietin Stimulating Agents Market by Type and Geography - Forecast and Analysis 2022-2026: The erythropoietin stimulating agents market share is expected to increase by USD 4.74 billion from 2021 to 2026, and the market's growth momentum will accelerate at a CAGR of 8.9%.
| Obsessive-Compulsive Disorder Drugs Market Scope | |
| Report Coverage | Details |
| Page number | 120 |
| Base year | 2021 |
| Forecast period | 2022-2026 |
| Growth momentum & CAGR | Accelerate at a CAGR of 5.55% |
| Market growth 2022-2026 | $ 266.78 million |
| Market structure | Fragmented |
| YoY growth (%) | 4.98 |
| Regional analysis | North America, Europe, Asia, and Rest of World (ROW) |
| Performing market contribution | North America at 55% |
| Key consumer countries | US, Canada, Germany, UK, and France |
| Competitive landscape | Leading companies, Competitive strategies, Consumer engagement scope |
| Key companies profiled | AbbVie Inc., Apotex Inc., Biohaven Pharmaceutical Holding Co. Ltd., Dr. Reddys Laboratories Ltd., Eli Lilly and Co., GlaxoSmithKline Plc, H Lundbeck AS, Jazz Pharmaceuticals Plc, Lannett Co. Inc., Lupin Ltd., Mallinckrodt Plc, Novartis AG, Omeros Corp., Pfizer Inc., Sun Pharmaceutical Industries Ltd., and Viatris Inc. |
| Market dynamics | Parent market analysis, Market growth inducers and obstacles, Fast-growing and slow-growing segment analysis, COVID 19 impact and recovery analysis and future consumer dynamics, and Market condition analysis for the forecast period. |
| Customization purview | If our report has not included the data that you are looking for, you can reach out to our analysts and get segments customized. |
Browse for Technavio ' Health Care ' Research Reports
Table of Contents
1 Executive Summary
- 1.1 Market overview
- Exhibit 01: Executive Summary – Chart on Market Overview
- Exhibit 02: Executive Summary – Data Table on Market Overview
- Exhibit 03: Executive Summary – Chart on Global Market Characteristics
- Exhibit 04: Executive Summary – Chart on Market by Geography
- Exhibit 05: Executive Summary – Chart on Market Segmentation by Product
- Exhibit 06: Executive Summary – Chart on Incremental Growth
- Exhibit 07: Executive Summary – Data Table on Incremental Growth
- Exhibit 08: Executive Summary – Chart on Vendor Market Positioning
2 Market Landscape
- 2.1 Market ecosystem
- Exhibit 09: Parent market
- Exhibit 10: Market Characteristics
3 Market Sizing
- 3.1 Market definition
- Exhibit 11: Offerings of vendors included in the market definition
- 3.2 Market segment analysis
- Exhibit 12: Market segments
- 3.3 Market size 2021
- 3.4 Market outlook: Forecast for 2021-2026
- Exhibit 13: Chart on Global - Market size and forecast 2021-2026 ($ million)
- Exhibit 14: Data Table on Global - Market size and forecast 2021-2026 ($ million)
- Exhibit 15: Chart on Global Market: Year-over-year growth 2021-2026 (%)
- Exhibit 16: Data Table on Global Market: Year-over-year growth 2021-2026 (%)
4 Five Forces Analysis
- 4.1 Five forces summary
- Exhibit 17: Five forces analysis - Comparison between 2021 and 2026
- 4.2 Bargaining power of buyers
- Exhibit 18: Chart on Bargaining power of buyers – Impact of key factors 2021 and 2026
- 4.3 Bargaining power of suppliers
- Exhibit 19: Bargaining power of suppliers – Impact of key factors in 2021 and 2026
- 4.4 Threat of new entrants
- Exhibit 20: Threat of new entrants – Impact of key factors in 2021 and 2026
- 4.5 Threat of substitutes
- Exhibit 21: Threat of substitutes – Impact of key factors in 2021 and 2026
- 4.6 Threat of rivalry
- Exhibit 22: Threat of rivalry – Impact of key factors in 2021 and 2026
- 4.7 Market condition
- Exhibit 23: Chart on Market condition - Five forces 2021 and 2026
5 Market Segmentation by Product
- 5.1 Market segments
- Exhibit 24: Chart on Product - Market share 2021-2026 (%)
- Exhibit 25: Data Table on Product - Market share 2021-2026 (%)
- 5.2 Comparison by Product
- Exhibit 26: Chart on Comparison by Product
- Exhibit 27: Data Table on Comparison by Product
- 5.3 SSRI - Market size and forecast 2021-2026
- Exhibit 28: Chart on SSRI - Market size and forecast 2021-2026 ($ million)
- Exhibit 29: Data Table on SSRI - Market size and forecast 2021-2026 ($ million)
- Exhibit 30: Chart on SSRI - Year-over-year growth 2021-2026 (%)
- Exhibit 31: Data Table on SSRI - Year-over-year growth 2021-2026 (%)
- 5.4 TSA - Market size and forecast 2021-2026
- Exhibit 32: Chart on TSA - Market size and forecast 2021-2026 ($ million)
- Exhibit 33: Data Table on TSA - Market size and forecast 2021-2026 ($ million)
- Exhibit 34: Chart on TSA - Year-over-year growth 2021-2026 (%)
- Exhibit 35: Data Table on TSA - Year-over-year growth 2021-2026 (%)
- 5.5 Others - Market size and forecast 2021-2026
- Exhibit 36: Chart on Others - Market size and forecast 2021-2026 ($ million)
- Exhibit 37: Data Table on Others - Market size and forecast 2021-2026 ($ million)
- Exhibit 38: Chart on Others - Year-over-year growth 2021-2026 (%)
- Exhibit 39: Data Table on Others - Year-over-year growth 2021-2026 (%)
- 5.6 Market opportunity by Product
- Exhibit 40: Market opportunity by Product ($ million)
6 Customer Landscape
- 6.1 Customer landscape overview
- Exhibit 41: Analysis of price sensitivity, lifecycle, customer purchase basket, adoption rates, and purchase criteria
7 Geographic Landscape
- 7.1 Geographic segmentation
- Exhibit 42: Chart on Market share by geography 2021-2026 (%)
- Exhibit 43: Data Table on Market share by geography 2021-2026 (%)
- 7.2 Geographic comparison
- Exhibit 44: Chart on Geographic comparison
- Exhibit 45: Data Table on Geographic comparison
- 7.3 North America - Market size and forecast 2021-2026
- Exhibit 46: Chart on North America - Market size and forecast 2021-2026 ($ million)
- Exhibit 47: Data Table on North America - Market size and forecast 2021-2026 ($ million)
- Exhibit 48: Chart on North America - Year-over-year growth 2021-2026 (%)
- Exhibit 49: Data Table on North America - Year-over-year growth 2021-2026 (%)
- 7.4 Europe - Market size and forecast 2021-2026
- Exhibit 50: Chart on Europe - Market size and forecast 2021-2026 ($ million)
- Exhibit 51: Data Table on Europe - Market size and forecast 2021-2026 ($ million)
- Exhibit 52: Chart on Europe - Year-over-year growth 2021-2026 (%)
- Exhibit 53: Data Table on Europe - Year-over-year growth 2021-2026 (%)
- 7.5 Asia - Market size and forecast 2021-2026
- Exhibit 54: Chart on Asia - Market size and forecast 2021-2026 ($ million)
- Exhibit 55: Data Table on Asia - Market size and forecast 2021-2026 ($ million)
- Exhibit 56: Chart on Asia - Year-over-year growth 2021-2026 (%)
- Exhibit 57: Data Table on Asia - Year-over-year growth 2021-2026 (%)
- 7.6 Rest of World (ROW) - Market size and forecast 2021-2026
- Exhibit 58: Chart on Rest of World (ROW) - Market size and forecast 2021-2026 ($ million)
- Exhibit 59: Data Table on Rest of World (ROW) - Market size and forecast 2021-2026 ($ million)
- Exhibit 60: Chart on Rest of World (ROW) - Year-over-year growth 2021-2026 (%)
- Exhibit 61: Data Table on Rest of World (ROW) - Year-over-year growth 2021-2026 (%)
- 7.7 US - Market size and forecast 2021-2026
- Exhibit 62: Chart on US - Market size and forecast 2021-2026 ($ million)
- Exhibit 63: Data Table on US - Market size and forecast 2021-2026 ($ million)
- Exhibit 64: Chart on US - Year-over-year growth 2021-2026 (%)
- Exhibit 65: Data Table on US - Year-over-year growth 2021-2026 (%)
- 7.8 Germany - Market size and forecast 2021-2026
- Exhibit 66: Chart on Germany - Market size and forecast 2021-2026 ($ million)
- Exhibit 67: Data Table on Germany - Market size and forecast 2021-2026 ($ million)
- Exhibit 68: Chart on Germany - Year-over-year growth 2021-2026 (%)
- Exhibit 69: Data Table on Germany - Year-over-year growth 2021-2026 (%)
- 7.9 UK - Market size and forecast 2021-2026
- Exhibit 70: Chart on UK - Market size and forecast 2021-2026 ($ million)
- Exhibit 71: Data Table on UK - Market size and forecast 2021-2026 ($ million)
- Exhibit 72: Chart on UK - Year-over-year growth 2021-2026 (%)
- Exhibit 73: Data Table on UK - Year-over-year growth 2021-2026 (%)
- 7.10 France - Market size and forecast 2021-2026
- Exhibit 74: Chart on France - Market size and forecast 2021-2026 ($ million)
- Exhibit 75: Data Table on France - Market size and forecast 2021-2026 ($ million)
- Exhibit 76: Chart on France - Year-over-year growth 2021-2026 (%)
- Exhibit 77: Data Table on France - Year-over-year growth 2021-2026 (%)
- 7.11 Canada - Market size and forecast 2021-2026
- Exhibit 78: Chart on Canada - Market size and forecast 2021-2026 ($ million)
- Exhibit 79: Data Table on Canada - Market size and forecast 2021-2026 ($ million)
- Exhibit 80: Chart on Canada - Year-over-year growth 2021-2026 (%)
- Exhibit 81: Data Table on Canada - Year-over-year growth 2021-2026 (%)
- 7.12 Market opportunity by geography
- Exhibit 82: Market opportunity by geography ($ million)
8 Drivers, Challenges, and Trends
- 8.1 Market drivers
- 8.2 Market challenges
- 8.3 Impact of drivers and challenges
- Exhibit 83: Impact of drivers and challenges in 2021 and 2026
- 8.4 Market trends
9 Vendor Landscape
- 9.1 Overview
- 9.2 Vendor landscape
- Exhibit 84: Overview on Criticality of inputs and Factors of differentiation
- 9.3 Landscape disruption
- Exhibit 85: Overview on factors of disruption
- 9.4 Industry risks
- Exhibit 86: Impact of key risks on business
10 Vendor Analysis
- 10.1 Vendors covered
- Exhibit 87: Vendors covered
- 10.2 Market positioning of vendors
- Exhibit 88: Matrix on vendor position and classification
- 10.3 AbbVie Inc.
- Exhibit 89: AbbVie Inc. - Overview
- Exhibit 90: AbbVie Inc. - Product / Service
- Exhibit 91: AbbVie Inc. - Key offerings
- 10.4 Apotex Inc.
- Exhibit 92: Apotex Inc. - Overview
- Exhibit 93: Apotex Inc. - Product / Service
- Exhibit 94: Apotex Inc. - Key offerings
- 10.5 Biohaven Pharmaceutical Holding Co. Ltd.
- Exhibit 95: Biohaven Pharmaceutical Holding Co. Ltd. - Overview
- Exhibit 96: Biohaven Pharmaceutical Holding Co. Ltd. - Product / Service
- Exhibit 97: Biohaven Pharmaceutical Holding Co. Ltd. - Key offerings
- 10.6 Dr. Reddys Laboratories Ltd.
- Exhibit 98: Dr. Reddys Laboratories Ltd. - Overview
- Exhibit 99: Dr. Reddys Laboratories Ltd. - Business segments
- Exhibit 100: Dr. Reddys Laboratories Ltd. - Key offerings
- Exhibit 101: Dr. Reddys Laboratories Ltd. - Segment focus
- 10.7 Eli Lilly and Co.
- Exhibit 102: Eli Lilly and Co. - Overview
- Exhibit 103: Eli Lilly and Co. - Product / Service
- Exhibit 104: Eli Lilly and Co. - Key offerings
- 10.8 GlaxoSmithKline Plc
- Exhibit 105: GlaxoSmithKline Plc - Overview
- Exhibit 106: GlaxoSmithKline Plc - Business segments
- Exhibit 107: GlaxoSmithKline Plc - Key news
- Exhibit 108: GlaxoSmithKline Plc - Key offerings
- Exhibit 109: GlaxoSmithKline Plc - Segment focus
- 10.9 H Lundbeck AS
- Exhibit 110: H Lundbeck AS - Overview
- Exhibit 111: H Lundbeck AS - Product / Service
- Exhibit 112: H Lundbeck AS - Key offerings
- 10.10 Jazz Pharmaceuticals Plc
- Exhibit 113: Jazz Pharmaceuticals Plc - Overview
- Exhibit 114: Jazz Pharmaceuticals Plc - Product / Service
- Exhibit 115: Jazz Pharmaceuticals Plc - Key news
- Exhibit 116: Jazz Pharmaceuticals Plc - Key offerings
- 10.11 Novartis AG
- Exhibit 117: Novartis AG - Overview
- Exhibit 118: Novartis AG - Business segments
- Exhibit 119: Novartis AG - Key offerings
- Exhibit 120: Novartis AG - Segment focus
- 10.12 Pfizer Inc.
- Exhibit 121: Pfizer Inc. - Overview
- Exhibit 122: Pfizer Inc. - Product / Service
- Exhibit 123: Pfizer Inc. - Key news
- Exhibit 124: Pfizer Inc. - Key offerings
11 Appendix
- 11.1 Scope of the report
- 11.2 Inclusions and exclusions checklist
- Exhibit 125: Inclusions checklist
- Exhibit 126: Exclusions checklist
- 11.3 Currency conversion rates for US$
- Exhibit 127: Currency conversion rates for US$
- 11.4 Research methodology
- Exhibit 128: Research methodology
- Exhibit 129: Validation techniques employed for market sizing
- Exhibit 130: Information sources
- 11.5 List of abbreviations
- Exhibit 131: List of abbreviations
About Us
Technavio is a leading global technology research and advisory company. Their research and analysis focus on emerging market trends and provide actionable insights to help businesses identify market opportunities and develop effective strategies to optimize their market positions.
With over 500 specialized analysts, Technavio's report library consists of more than 17,000 reports and counting, covering 800 technologies, spanning 50 countries. Their client base consists of enterprises of all sizes, including more than 100 Fortune 500 companies. This growing client base relies on Technavio's comprehensive coverage, extensive research, and actionable market insights to identify opportunities in existing and potential markets and assess their competitive positions within changing market scenarios.
Contact Technavio ResearchJesse MaidaMedia & Marketing ExecutiveUS: +1 844 364 1100UK: +44 203 893 3200Email:[email protected] Website:
SOURCE Technavio

Legal Disclaimer:
MENAFN provides the
information “as is” without warranty of any kind. We do not accept
any responsibility or liability for the accuracy, content, images,
videos, licenses, completeness, legality, or reliability of the information
contained in this article. If you have any complaints or copyright
issues related to this article, kindly contact the provider above.
Most popular stories
Market Research

More Story


Comments
No comment