


403
Sorry!!
Error! We're sorry, but the page you were looking for doesn't exist.
Metaverse In Healthcare Market| Evolving Opportunities With 3D Systems Corp. And 8Chili Inc. | Technavio'
(MENAFN- PR Newswire)
Technavio has announced its latest market research report titled Metaverse in Healthcare Market by Component and Geography - Forecast and Analysis 2022-2026
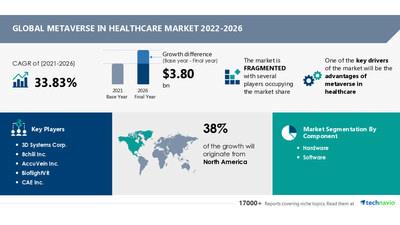
NEW YORK, June 29, 2022 /PRNewswire/ -- The Metaverse in Healthcare Market is expected to grow by USD 3.80 billion from 2021 to 2026, at a CAGR of 33.83% during the forecast period. The metaverse in healthcare market report also offers information on several market vendors, including 3D Systems Corp., 8chili Inc., AccuVein Inc., BioflightVR, CAE Inc., Devden Creative Solutions Pvt. Ltd., Dhi Tattva Solutions Pvt. Ltd., Eon Reality Inc., ImmersiveTouch Inc., Intuitive Surgical Inc., Koninklijke Philips NV, Medical Realities Ltd., Siemens AG, Sky gate, UnitedHealth Group Inc., Wipro Ltd., and WorldViz Inc. among others. Request sample pages
Technavio has announced its latest market research report titled Metaverse in Healthcare Market by Component and Geography - Forecast and Analysis 2022-2026
Read the 120-page report with TOC on 'Metaverse in Healthcare Market Analysis Report by Component (Hardware and Software) and Geography (North America, Europe, APAC, South America, and Middle East and Africa), and the Segment Forecasts,2022-2026'. Get Report Snapshot
Market DriverThe benefits of a metaverse in healthcare are one of the main drivers propelling growth in the market for it. The fact that metaverse solutions minimize problems brought on by human mistakes and weariness, which, in turn, improves service quality throughout the healthcare sector, is a major factor in the growing acceptance of metaverse in the business.
Software and hardware systems offer a consistent level of precision and high-quality output because they are less likely to make the same mistakes as individuals, including losing focus. The incorporation of a metaverse in healthcare systems makes it simple to identify and correct any deviation from a patient's care plan. However, factors such as infrastructural and integration issues may impede the market growth
For additional information related to market growth factors, Request Sample Report Now !
Major Five Metaverse in Healthcare Companies:The growing competition in the market is compelling vendors to adopt various growth strategies such as promotional activities and spending on advertisements to improve the visibility of their services. Some vendors are also adopting inorganic growth strategies such as M&As to remain competitive in the market.
The report analyzes the market's competitive landscape and offers information on several market vendors, including:
- 3D Systems Corp.
- 8chili Inc.
- AccuVein Inc.
- BioflightVR
- CAE Inc.
- Devden Creative Solutions Pvt. Ltd.
- Dhi Tattva Solutions Pvt. Ltd.
- Eon Reality Inc.
- ImmersiveTouch Inc.
- Intuitive Surgical Inc.
- Koninklijke Philips NV
- Medical Realities Ltd.
Find additional highlights on the growth strategies adopted by vendors and their product offerings, Read Sample Report.
Metaverse In Healthcare Market Geography Outlook
- North America - size and forecast 2021-2026
- Europe - size and forecast 2021-2026
- APAC - size and forecast 2021-2026
- South America - size and forecast 2021-2026
North America will account for 38% of market growth. North American healthcare metaverse's two main markets are the US and Canada. The market in this region will grow more quickly than the markets in South America and the Middle East and Africa.
Over the course of the projection period, the metaverse in healthcare market expansion in North America will be facilitated by the advanced and mature technology environment across the healthcare industry , particularly in developed countries.
Do you want to learn about the contribution of each segment of the predictive analytics market? Get an Exclusive Sample Report
Related Reports:
Knee Replacement Market by Product and Geography - Forecast and Analysis 2022-2026
Invisible Orthodontics Market in North America by Product and Geography - Forecast and Analysis 2022-2026
| Metaverse in Healthcare Market Scope | |
| Report Coverage | Details |
| Page number | 120 |
| Base year | 2021 |
| Forecast period | 2022-2026 |
| Growth momentum & CAGR | Accelerate at a CAGR of 33.83% |
| Market growth 2022-2026 | $ 3.80 billion |
| Market structure | Fragmented |
| YoY growth (%) | 32.0 |
| Regional analysis | North America, Europe, APAC, South America, and Middle East and Africa |
| Performing market contribution | North America at 38% |
| Key consumer countries | US, Canada, China, Germany, and UK |
| Competitive landscape | Leading companies, Competitive strategies, Consumer engagement scope |
| Key companies profiled | 3D Systems Corp., 8chili Inc., AccuVein Inc., BioflightVR, CAE Inc., Devden Creative Solutions Pvt. Ltd., Dhi Tattva Solutions Pvt. Ltd., Eon Reality Inc., ImmersiveTouch Inc., Intuitive Surgical Inc., Koninklijke Philips NV, Medical Realities Ltd., Microsoft Corp., MindMaze SA, Oodles Technologies, Siemens AG, Sky gate, UnitedHealth Group Inc., Wipro Ltd., and WorldViz Inc. |
| Market dynamics | Parent market analysis, Market growth inducers and obstacles, Fast-growing and slow-growing segment analysis, COVID 19 impact and recovery analysis and future consumer dynamics, Market condition analysis for the forecast period |
| Customization purview | If our report has not included the data that you are looking for, you can reach out to our analysts and get segments customized. |
Table of Contents
1 Executive Summary
- 1.1 Market overview
- Exhibit 01: Executive Summary – Chart on Market Overview
- Exhibit 02: Executive Summary – Data Table on Market Overview
- Exhibit 03: Executive Summary – Chart on Global Market Characteristics
- Exhibit 04: Executive Summary – Chart on Market by Geography
- Exhibit 05: Executive Summary – Chart on Market Segmentation by Component
- Exhibit 06: Executive Summary – Chart on Incremental Growth
- Exhibit 07: Executive Summary – Data Table on Incremental Growth
- Exhibit 08: Executive Summary – Chart on Vendor Market Positioning
2 Market Landscape
- 2.1 Market ecosystem
- Exhibit 09: Parent market
- Exhibit 10: Market Characteristics
3 Market Sizing
- 3.1 Market definition
- Exhibit 11: Offerings of vendors included in the market definition
- 3.2 Market segment analysis
- Exhibit 12: Market segments
- 3.3 Market size 2021
- 3.4 Market outlook: Forecast for 2021-2026
- Exhibit 13: Chart on Global - Market size and forecast 2021-2026 ($ million)
- Exhibit 14: Data Table on Global - Market size and forecast 2021-2026 ($ million)
- Exhibit 15: Chart on Global Market: Year-over-year growth 2021-2026 (%)
- Exhibit 16: Data Table on Global Market: Year-over-year growth 2021-2026 (%)
4 Five Forces Analysis
- 4.1 Five forces summary
- Exhibit 17: Five forces analysis - Comparison between 2021 and 2026
- 4.2 Bargaining power of buyers
- Exhibit 18: Chart on Bargaining power of buyers – Impact of key factors 2021 and 2026
- 4.3 Bargaining power of suppliers
- Exhibit 19: Bargaining power of suppliers – Impact of key factors in 2021 and 2026
- 4.4 Threat of new entrants
- Exhibit 20: Threat of new entrants – Impact of key factors in 2021 and 2026
- 4.5 Threat of substitutes
- Exhibit 21: Threat of substitutes – Impact of key factors in 2021 and 2026
- 4.6 Threat of rivalry
- Exhibit 22: Threat of rivalry – Impact of key factors in 2021 and 2026
- 4.7 Market condition
- Exhibit 23: Chart on Market condition - Five forces 2021 and 2026
5 Market Segmentation by Component
- 5.1 Market segments
- Exhibit 24: Chart on Component - Market share 2021-2026 (%)
- Exhibit 25: Data Table on Component - Market share 2021-2026 (%)
- 5.2 Comparison by Component
- Exhibit 26: Chart on Comparison by Component
- Exhibit 27: Data Table on Comparison by Component
- 5.3 Hardware - Market size and forecast 2021-2026
- Exhibit 28: Chart on Hardware - Market size and forecast 2021-2026 ($ million)
- Exhibit 29: Data Table on Hardware - Market size and forecast 2021-2026 ($ million)
- Exhibit 30: Chart on Hardware - Year-over-year growth 2021-2026 (%)
- Exhibit 31: Data Table on Hardware - Year-over-year growth 2021-2026 (%)
- 5.4 Software - Market size and forecast 2021-2026
- Exhibit 32: Chart on Software - Market size and forecast 2021-2026 ($ million)
- Exhibit 33: Data Table on Software - Market size and forecast 2021-2026 ($ million)
- Exhibit 34: Chart on Software - Year-over-year growth 2021-2026 (%)
- Exhibit 35: Data Table on Software - Year-over-year growth 2021-2026 (%)
- 5.5 Market opportunity by Component
- Exhibit 36: Market opportunity by Component ($ million)
6 Customer Landscape
- 6.1 Customer landscape overview
- Exhibit 37: Analysis of price sensitivity, lifecycle, customer purchase basket, adoption rates, and purchase criteria
7 Geographic Landscape
- 7.1 Geographic segmentation
- Exhibit 38: Chart on Market share by geography 2021-2026 (%)
- Exhibit 39: Data Table on Market share by geography 2021-2026 (%)
- 7.2 Geographic comparison
- Exhibit 40: Chart on Geographic comparison
- Exhibit 41: Data Table on Geographic comparison
- 7.3 North America - Market size and forecast 2021-2026
- Exhibit 42: Chart on North America - Market size and forecast 2021-2026 ($ million)
- Exhibit 43: Data Table on North America - Market size and forecast 2021-2026 ($ million)
- Exhibit 44: Chart on North America - Year-over-year growth 2021-2026 (%)
- Exhibit 45: Data Table on North America - Year-over-year growth 2021-2026 (%)
- 7.4 Europe - Market size and forecast 2021-2026
- Exhibit 46: Chart on Europe - Market size and forecast 2021-2026 ($ million)
- Exhibit 47: Data Table on Europe - Market size and forecast 2021-2026 ($ million)
- Exhibit 48: Chart on Europe - Year-over-year growth 2021-2026 (%)
- Exhibit 49: Data Table on Europe - Year-over-year growth 2021-2026 (%)
- 7.5 APAC - Market size and forecast 2021-2026
- Exhibit 50: Chart on APAC - Market size and forecast 2021-2026 ($ million)
- Exhibit 51: Data Table on APAC - Market size and forecast 2021-2026 ($ million)
- Exhibit 52: Chart on APAC - Year-over-year growth 2021-2026 (%)
- Exhibit 53: Data Table on APAC - Year-over-year growth 2021-2026 (%)
- 7.6 South America - Market size and forecast 2021-2026
- Exhibit 54: Chart on South America - Market size and forecast 2021-2026 ($ million)
- Exhibit 55: Data Table on South America - Market size and forecast 2021-2026 ($ million)
- Exhibit 56: Chart on South America - Year-over-year growth 2021-2026 (%)
- Exhibit 57: Data Table on South America - Year-over-year growth 2021-2026 (%)
- 7.7 Middle East and Africa - Market size and forecast 2021-2026
- Exhibit 58: Chart on Middle East and Africa - Market size and forecast 2021-2026 ($ million)
- Exhibit 59: Data Table on Middle East and Africa - Market size and forecast 2021-2026 ($ million)
- Exhibit 60: Chart on Middle East and Africa - Year-over-year growth 2021-2026 (%)
- Exhibit 61: Data Table on Middle East and Africa - Year-over-year growth 2021-2026 (%)
- 7.8 US - Market size and forecast 2021-2026
- Exhibit 62: Chart on US - Market size and forecast 2021-2026 ($ million)
- Exhibit 63: Data Table on US - Market size and forecast 2021-2026 ($ million)
- Exhibit 64: Chart on US - Year-over-year growth 2021-2026 (%)
- Exhibit 65: Data Table on US - Year-over-year growth 2021-2026 (%)
- 7.9 China - Market size and forecast 2021-2026
- Exhibit 66: Chart on China - Market size and forecast 2021-2026 ($ million)
- Exhibit 67: Data Table on China - Market size and forecast 2021-2026 ($ million)
- Exhibit 68: Chart on China - Year-over-year growth 2021-2026 (%)
- Exhibit 69: Data Table on China - Year-over-year growth 2021-2026 (%)
- 7.10 Germany - Market size and forecast 2021-2026
- Exhibit 70: Chart on Germany - Market size and forecast 2021-2026 ($ million)
- Exhibit 71: Data Table on Germany - Market size and forecast 2021-2026 ($ million)
- Exhibit 72: Chart on Germany - Year-over-year growth 2021-2026 (%)
- Exhibit 73: Data Table on Germany - Year-over-year growth 2021-2026 (%)
- 7.11 Canada - Market size and forecast 2021-2026
- Exhibit 74: Chart on Canada - Market size and forecast 2021-2026 ($ million)
- Exhibit 75: Data Table on Canada - Market size and forecast 2021-2026 ($ million)
- Exhibit 76: Chart on Canada - Year-over-year growth 2021-2026 (%)
- Exhibit 77: Data Table on Canada - Year-over-year growth 2021-2026 (%)
- 7.12 UK - Market size and forecast 2021-2026
- Exhibit 78: Chart on UK - Market size and forecast 2021-2026 ($ million)
- Exhibit 79: Data Table on UK - Market size and forecast 2021-2026 ($ million)
- Exhibit 80: Chart on UK - Year-over-year growth 2021-2026 (%)
- Exhibit 81: Data Table on UK - Year-over-year growth 2021-2026 (%)
- 7.13 Market opportunity by geography
- Exhibit 82: Market opportunity by geography ($ million)
8 Drivers, Challenges, and Trends
- 8.1 Market drivers
- 8.2 Market challenges
- 8.3 Impact of drivers and challenges
- Exhibit 83: Impact of drivers and challenges in 2021 and 2026
- 8.4 Market trends
9 Vendor Landscape
- 9.1 Overview
- 9.2 Vendor landscape
- Exhibit 84: Overview on Criticality of inputs and Factors of differentiation
- 9.3 Landscape disruption
- Exhibit 85: Overview on factors of disruption
- 9.4 Industry risks
- Exhibit 86: Impact of key risks on business
10 Vendor Analysis
- 10.1 Vendors covered
- Exhibit 87: Vendors covered
- 10.2 Market positioning of vendors
- Exhibit 88: Matrix on vendor position and classification
- 10.3 3D Systems Corp.
- Exhibit 89: 3D Systems Corp. - Overview
- Exhibit 90: 3D Systems Corp. - Product / Service
- Exhibit 91: 3D Systems Corp. - Key news
- Exhibit 92: 3D Systems Corp. - Key offerings
- 10.4 8chili Inc.
- Exhibit 93: 8chili Inc. - Overview
- Exhibit 94: 8chili Inc. - Product / Service
- Exhibit 95: 8chili Inc. - Key offerings
- 10.5 AccuVein Inc.
- Exhibit 96: AccuVein Inc. - Overview
- Exhibit 97: AccuVein Inc. - Product / Service
- Exhibit 98: AccuVein Inc. - Key offerings
- 10.6 Intuitive Surgical Inc.
- Exhibit 99: Intuitive Surgical Inc. - Overview
- Exhibit 100: Intuitive Surgical Inc. - Product / Service
- Exhibit 101: Intuitive Surgical Inc. - Key offerings
- 10.7 Koninklijke Philips NV
- Exhibit 102: Koninklijke Philips NV - Overview
- Exhibit 103: Koninklijke Philips NV - Business segments
- Exhibit 104: Koninklijke Philips NV - Key news
- Exhibit 105: Koninklijke Philips NV - Key offerings
- Exhibit 106: Koninklijke Philips NV - Segment focus
- 10.8 Microsoft Corp.
- Exhibit 107: Microsoft Corp. - Overview
- Exhibit 108: Microsoft Corp. - Business segments
- Exhibit 109: Microsoft Corp. - Key news
- Exhibit 110: Microsoft Corp. - Key offerings
- Exhibit 111: Microsoft Corp. - Segment focus
- 10.9 Oodles Technologies
- Exhibit 112: Oodles Technologies - Overview
- Exhibit 113: Oodles Technologies - Product / Service
- Exhibit 114: Oodles Technologies - Key offerings
- 10.10 Siemens AG
- Exhibit 115: Siemens AG - Overview
- Exhibit 116: Siemens AG - Business segments
- Exhibit 117: Siemens AG - Key news
- Exhibit 118: Siemens AG - Key offerings
- Exhibit 119: Siemens AG - Segment focus
- 10.11 Wipro Ltd.
- Exhibit 120: Wipro Ltd. - Overview
- Exhibit 121: Wipro Ltd. - Business segments
- Exhibit 122: Wipro Ltd. - Key news
- Exhibit 123: Wipro Ltd. - Key offerings
- Exhibit 124: Wipro Ltd. - Segment focus
- 10.12 WorldViz Inc.
- Exhibit 125: WorldViz Inc. - Overview
- Exhibit 126: WorldViz Inc. - Product / Service
- Exhibit 127: WorldViz Inc. - Key offerings
11 Appendix
- 11.1 Scope of the report
- 11.2 Inclusions and exclusions checklist
- Exhibit 128: Inclusions checklist
- Exhibit 129: Exclusions checklist
- 11.3 Currency conversion rates for US$
- Exhibit 130: Currency conversion rates for US$
- 11.4 Research methodology
- Exhibit 131: Research methodology
- Exhibit 132: Validation techniques employed for market sizing
- Exhibit 133: Information sources
- 11.5 List of abbreviations
- Exhibit 134: List of abbreviations
Technavio is a leading global technology research and advisory company. Their research and analysis focus on emerging market trends and provides actionable insights to help businesses identify market opportunities and develop effective strategies to optimize their market positions.
With over 500 specialized analysts, Technavio's report library consists of more than 17,000 reports and counting, covering 800 technologies, spanning across 50 countries. Their client base consists of enterprises of all sizes, including more than 100 Fortune 500 companies. This growing client base relies on Technavio's comprehensive coverage, extensive research, and actionable market insights to identify opportunities in existing and potential markets and assess their competitive positions within changing market scenarios.
ContactsTechnavio ResearchJesse MaidaMedia & Marketing ExecutiveUS: +1 844 364 1100UK: +44 203 893 3200Email: [email protected] Website:
SOURCE Technavio

Legal Disclaimer:
MENAFN provides the
information “as is” without warranty of any kind. We do not accept
any responsibility or liability for the accuracy, content, images,
videos, licenses, completeness, legality, or reliability of the information
contained in this article. If you have any complaints or copyright
issues related to this article, kindly contact the provider above.
Most popular stories
Market Research

More Story


Comments
No comment