


403
Sorry!!
Error! We're sorry, but the page you were looking for doesn't exist.

A Guide to Floor-Trader Pivots
(MENAFN- DailyFX) Floor-Trader Pivots assist traders in identifying areas in a chart where price is likely to approach and can be used to set appropriate targets, while effectively managing risk. It is one of many types ofpivot pointstraders can use to determine key levels, but the concept ofsupport and resistanceis well entrenched in all of them.
Keep reading to learn more about:
- Definition of Floor-Trader Pivots
- How to calculate Floor-Trader Pivots
- Trading with Floor-Trader Pivots
What are floor trader pivots?
Floor-Trader Pivots, also known as 'Classical Pivots', denote areas on a chart where future price is likely to encounter support or resistance. The pivot points are calculated according to a specific formula that takes into account past price data; and projects three levels of support and resistance based around the 'pivot' itself.

The name 'Floor-Trader Pivots' comes from a time before online trading where 'floor trader's' needed an easy formula to determine whether a price was relatively cheap or expensive before shouting bids and offers across the room.
Modern day traders looking to emulate the floor traders can do so with ease as most charting packages have pivot points included in the selection of indicators.
How to calculate floor trader pivots
The default time frames include daily, weekly or monthly pivot points and they can be calculated as follows:
The Pivot: (Previous high + previous low + previous close) / 3
| Pivot location relative to price | Direction bias |
| Price above pivot | Bullish bias |
| Price below pivot | Bearish bias |
R1: (Current pivot Value X 2) – Previous Low
R2: Current pivot + (R1 – S1)
R3: Current pivot – (R2 – S2)
S1: (Current pivot value X 2) – Previous High
S2: Current pivot value – (R1 – S1)
S3: Current pivot value – (R2 - S2)
Many traders scour the internet searching for Floor-Trader Pivot calculators to calculate the values for each market of interest. DailyFX removes this hassle with our dedicated page onpivot points ; outlining R1, R2, R3, pivot, S1, S2, S3 for all top markets. The page can be tailored to show hourly, daily, weekly and monthly data and can be applied to Classical, Camarilla and Woodie Pivots.
Using Floor-Trader Pivots: Top Tips
1. Filter trades in the direction of the trend
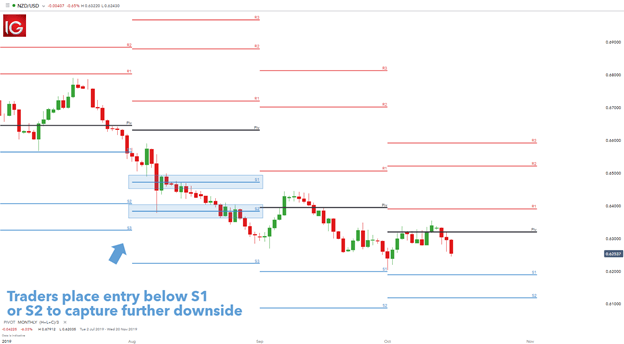
In well-established downtrends, there are morepipsto benefit from in the direction of thetrendas opposed to pips on offer against the trend. Traders can use the support and resistance points to look for breakout trades in the direction of the trend. The concept is simple, although the chart can be somewhat cluttered.
As you can see in the chart below (highlighted in blue), the S1 and S2 bands act as resistance points in the current downtrend. Forex traders will look to place entry orders a few pips below these levels to capture further downside movements in price.
NZD/USDdaily chart
 -p
-p
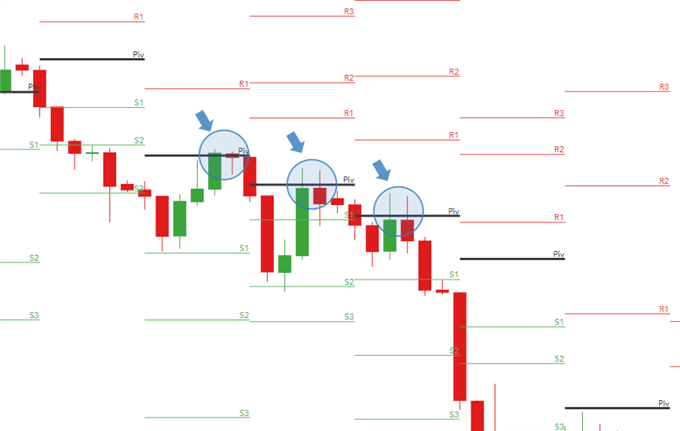
Classical pivots can present attractive entries when trading in the direction of the trend. The chart below zooms into an existing downtrend, showing how price retraces up towards the pivot before continuing down. Traders can set working orders at these levels or simply enter short after price has reached the pivot and moved back down.
GBP/USDdaily chart
 -p
-p
Traders can use the levels of support provided by the Floor-Trader Pivots as dynamic support or dynamic stops.
This becomes clear when observing the belowGBP/USDchart below. As price moves up, the S1 level moves up too and traders can trail their stops in line with this level to lock in profits if the market reverses. Tighter stops will trail the S1 in an uptrend and stops placed at the S2 and S3 can be used in more volatile markets provided a smaller trade size is utilized.
-pp-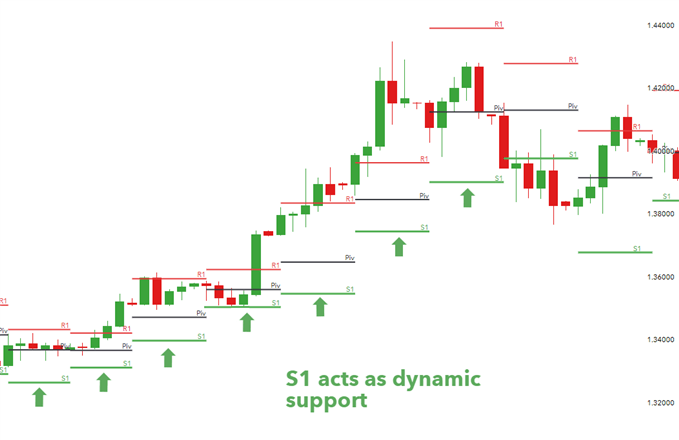
Find out more on trading with pivot points
- For an in-depth look at pivot points and how to use them in forex trading, read our article onpivot point strategies for forex traders .
- Whether you prefer Camarilla, Woodie or Classical pivot points, we have you covered with automatedpivot pointstable.
- The central concept around pivot points is that of support and resistance. Learn the ins and outs of this concept through ourguide to support and resistance trading .

Legal Disclaimer:
MENAFN provides the
information “as is” without warranty of any kind. We do not accept
any responsibility or liability for the accuracy, content, images,
videos, licenses, completeness, legality, or reliability of the information
contained in this article. If you have any complaints or copyright
issues related to this article, kindly contact the provider above.
Most popular stories
Market Research

More Story


Comments
No comment