


403
Sorry!!
Error! We're sorry, but the page you were looking for doesn't exist.

The Head and Shoulders Pattern: A Trader's Guide
(MENAFN- DailyFX) Often considered the most steadfast of all major reversal patterns, the Head and Shoulders chart pattern is employed by novice and experience traders alike to speculate on both forex and stock markets. The benefit of this chart pattern is defined areas to set risk levels and profit targets.
The inverse pattern is equally useful in any trader's arsenal and adopts the same approach as the traditional Head and Shoulders pattern. The head and shoulders stock and forex analysis process will exercise the same logic making it a great tool to include in a trader's repertoire.
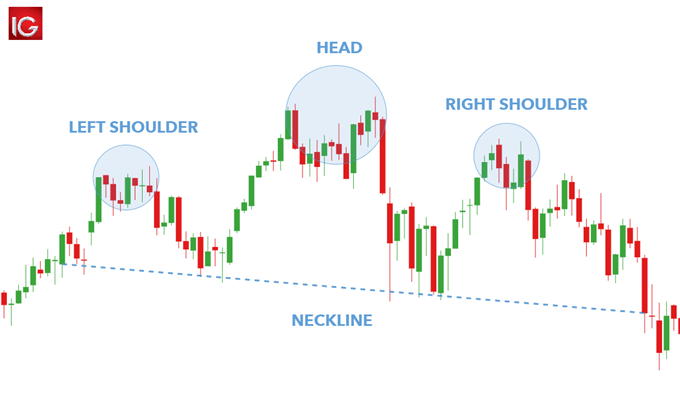
Head and Shoulders Chart Pattern: Main Talking PointsWhat is a Head and Shoulders pattern? What is the Inverse Head and Shoulders pattern? How to identify Head and Shoulders patterns on forex and stock charts Advantages and limitations of the Head and Shoulders pattern What is the Head and Shoulders Pattern?The Head and Shoulders chart pattern is a price reversal pattern that helps traders identify when a reversal may be underway after atrendhas exhausted itself. This reversal signals the end of an uptrend. The Head and Shoulders pattern has a distinctive appearance resembling its namesake which includes a distinct 'left shoulder', 'head', 'right shoulder' and 'neckline' formation (see image below).
What is the Inverse Head and Shoulders Pattern?
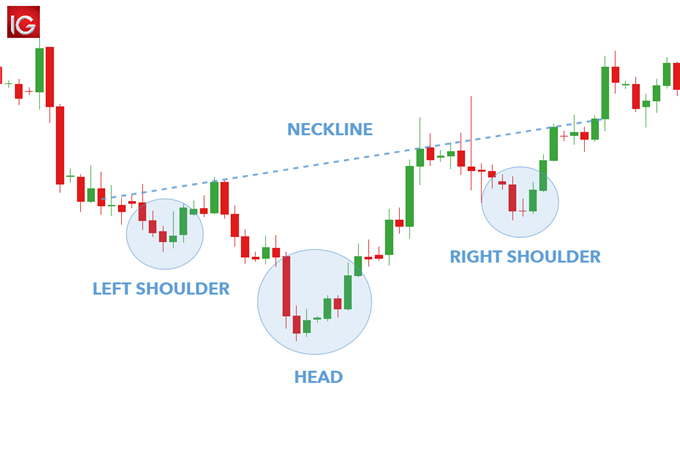
The Inverse Head and Shoulders pattern reflects the same structure as the standard version but reversed, making it observable in a downtrend (see image below). The Inverse Head and Shoulders indicates a reversal of a downtrend as higher lows are created.
How to identify Head and Shoulders Patterns on Forex & Stock Charts
Recognizing the Head and Shoulders pattern on both forex and stock charts entail the exact same actions; making it a versatile tool to include in anytrading strategy . The following list gives a simple breakdown of the key action points when identifying this pattern:
Identify the overall market trend usingprice actionandtechnical indicators(preceding uptrend) Isolate the Head and Shoulders chart construction The distance between the 'Head' and 'Shoulders' should be as close to equidistant as possible Delineate the neckline at the low point between both 'shoulders' – preferably horizontal but not obligatory How to Trade the Head and Shoulders PatternOnce a trader knows how to identify the standard and inverse head and shoulders patterns, it's relatively easy to apply it to technical analysis in both forex and equity markets.
Trading stocks with the Head and Shoulders pattern
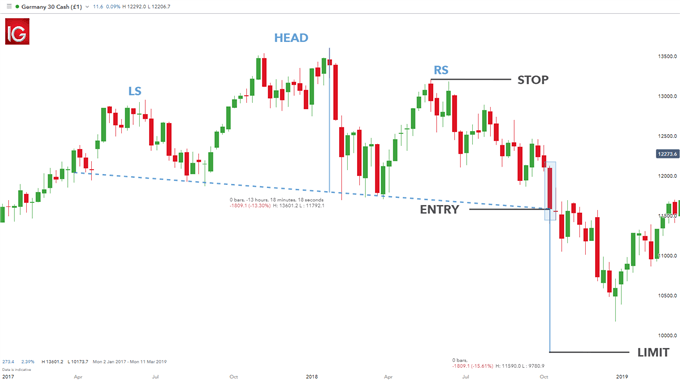
The chart above shows a Head and Shoulders pattern on theGermany 30 (DAX 30) stock index . The formation of the pattern is clear with the neckline highlighted by the dashed blue horizontal line. Traders will look to enter a short trade after a confirmation close below the neckline as seen by the 'ENTRY' label on the chart or the pip movement below the neckline. Some traders employ the 'two-day' close rule which necessitates a second confirmation candle closing below the neckline before opening the short trade. Trading on the pip break below the neckline allows traders to benefit from the full move down however, this tactic is riskier in that the breakout below the neckline has not been confirmed by a candle close.
There is a general rule of thumb to designatestopandlimitlevels. Taking the high point off the 'right shoulder' will specify the stop level whilst the vertical distance between the neckline and high of the 'head' will approximate the limit distance – 1832.8pipsin this case. Therisk-reward ratioon this trade is roughly 1:1.2 which is still within the DailyFX recommendedrisk managementparameters.
Trading forex with the Inverse Head and Shoulders pattern
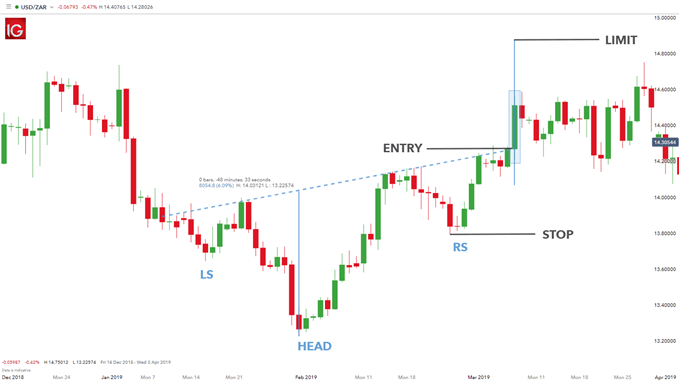
The Inverse Head and Shoulder pattern on theUSD/ZARforex pair above shows an asymmetrical structure which is quite common in most formations. The neckline is slightly skewed however, still maintaining the integrity of the pattern.
The long entry level is highlighted by the neckline break or the price candle close above the neckline. Thestop distanceis taken from the low from the 'right shoulder' whilst thelimitdistance is calculated by measuring the distance from the 'head' low to the neckline.
Advantages and Limitations of the Head and Shoulders PatternAdvantages | Limitations |
Easy to identify for more experienced traders | Difficult to identify for novice traders |
Defined risk and take profit levels | Confirmation candle may close far below neckline resulting in large stop loss distances which may need to be reviewed |
Potential to exploit big market movements | Price can pullback and retest the neckline often confusing beginner traders |
Useful in all markets | Risk-reward ratios are not always favourable |

Legal Disclaimer:
MENAFN provides the
information “as is” without warranty of any kind. We do not accept
any responsibility or liability for the accuracy, content, images,
videos, licenses, completeness, legality, or reliability of the information
contained in this article. If you have any complaints or copyright
issues related to this article, kindly contact the provider above.
Most popular stories
Market Research

More Story


Comments
No comment