BTC/USD Forex Signal 27/11: Recovery In Progress (Chart)
- Buy the BTC/USD pair and set a take-profit at 95,000. Add a stop-loss at 85,000. Timeline: 1-2 days.
- Sell the BTC/USD pair and set a take-profit at 85,000. Add a stop-loss at 95,000.
Bitcoin price also rebounded as investors placed their bets that the Federal Reserve will cut interest rates in the coming meeting. Data compiled by Polymarket and Kalshi shows that odds of these rate cuts have jumped to 83% from below 40% last week. Bitcoin and other altcoins often do well when the bank is cutting rates.
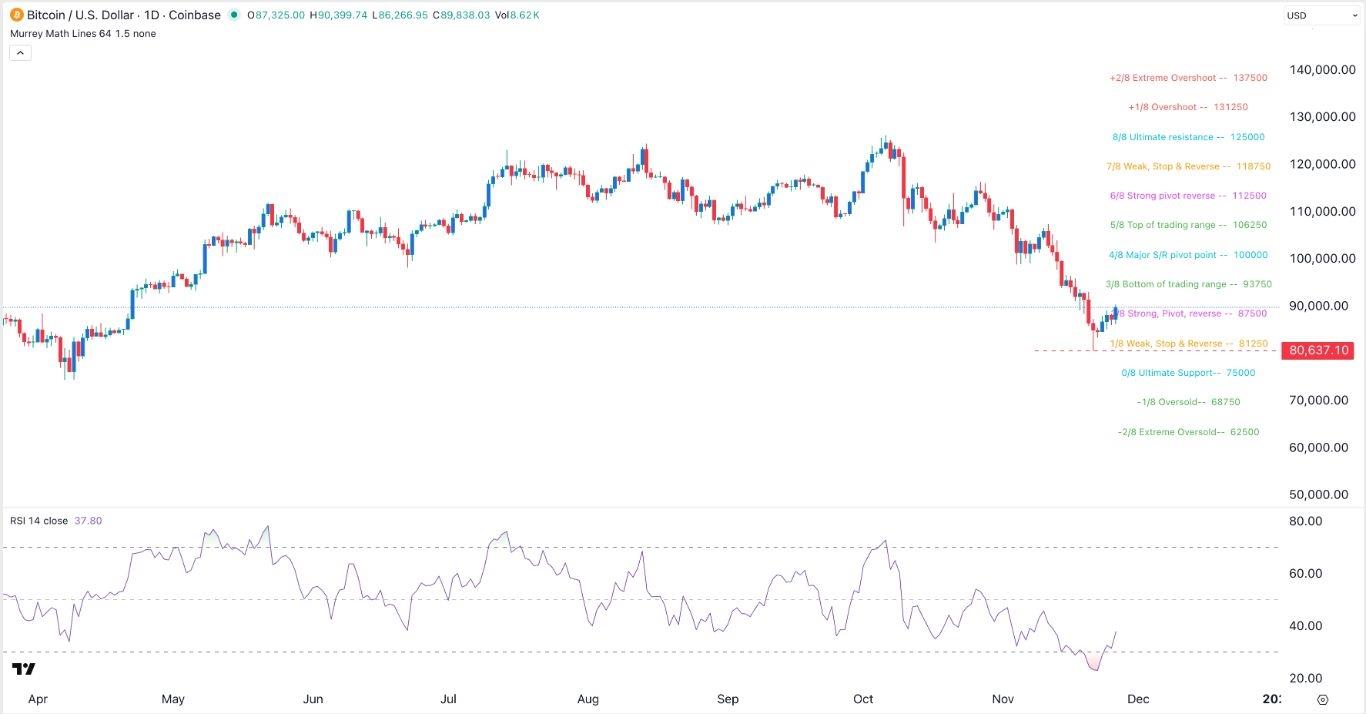
EURUSD Chart by TradingViewBTC/USD Technical AnalysisThe daily timeframe chart shows that the BTC/USD pair has rebounded in the past few days. It has bounced from a low of 80,637 last week, where it formed a hammer candle. A hammer is made up of a small body and a long lower shadow. It is one of the most bullish patterns in technical analysis.The Relative Strength Index (RSI) has moved from last week's low of 23 to 37. A rising RSI is a sign that the bullish momentum is continuing.Bitcoin has moved above the Strong, Pivot, Reverse point of the Murrey Math Lines at 87,500. Moving above that level is a bullish sign as it shows that the pair is gaining momentum. Therefore, the pair will likely continue rising as bulls target the major S&R pivot point at 100,000.Ready to trade our daily Forex signals? Here's a list of some of the best crypto brokers to check out.
Legal Disclaimer:
MENAFN provides the
information “as is” without warranty of any kind. We do not accept
any responsibility or liability for the accuracy, content, images,
videos, licenses, completeness, legality, or reliability of the information
contained in this article. If you have any complaints or copyright
issues related to this article, kindly contact the provider above.


Comments
No comment