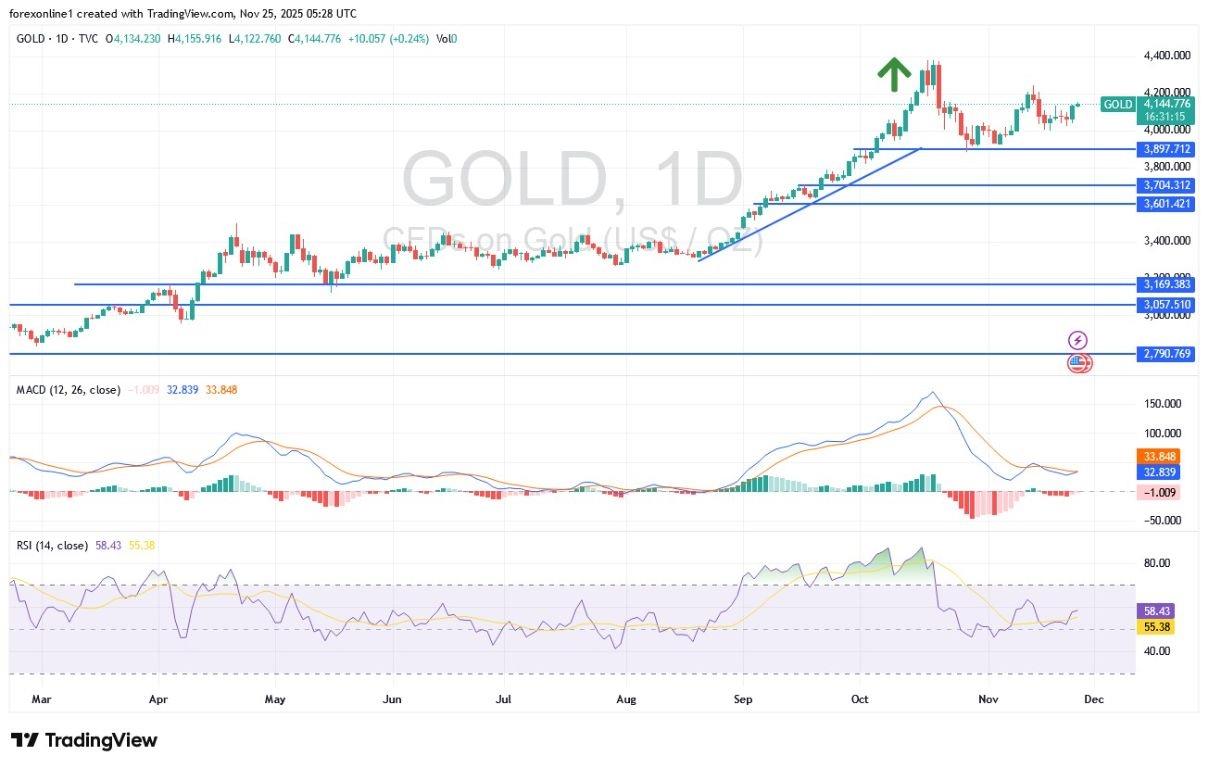
Gold Analysis 25/11: Gold Index Remains Supported (Chart)
- The overall of Gold Trend: Neutral with an Bullish Bias. Today's Gold Support Points: $4010 – $3960 – $3900 per ounce. Today's Gold Resistance Points: $4090 – $4130 – $4200 per ounce.
- Sell gold from the resistance level of $4170 with a target of $3980 and a stop-loss at $4200. Buy gold from the support level of $3970 with a target of $4150 and a stop-loss at $3920.
Technically, based on the performance on the daily timeframe chart, the 14-day Relative Strength Index (RSI) is around a reading of 56, confirming the bulls' readiness to launch strongly upwards. At the same time, the MACD indicator lines are in a neutral position, awaiting motivating factors to confirm the upward scenario. This could happen with the bulls' return to the vicinity of the $4220 per ounce resistance again. As previously mentioned, the $4000 per ounce level will remain the dividing line between the control of the bears and the bulls.
EURUSD Chart by TradingViewTrading Tips:Keep in mind that increasing market tensions and rising uncertainty about the future of central bank policies are in favor of gold market gains in the coming period, as it is the traditional safe haven.Ready to trade our daily Forex analysis? We've made a list of the best online forex trading platform worth trading with.
Legal Disclaimer:
MENAFN provides the
information “as is” without warranty of any kind. We do not accept
any responsibility or liability for the accuracy, content, images,
videos, licenses, completeness, legality, or reliability of the information
contained in this article. If you have any complaints or copyright
issues related to this article, kindly contact the provider above.


Comments
No comment