


403
Sorry!!
Error! We're sorry, but the page you were looking for doesn't exist.

US Money Markets: Repo Tight Enough For The Fed To Build Bills
(MENAFN- ING)
The Fed moves to using T-bill buying more actively as a means to managing reserves
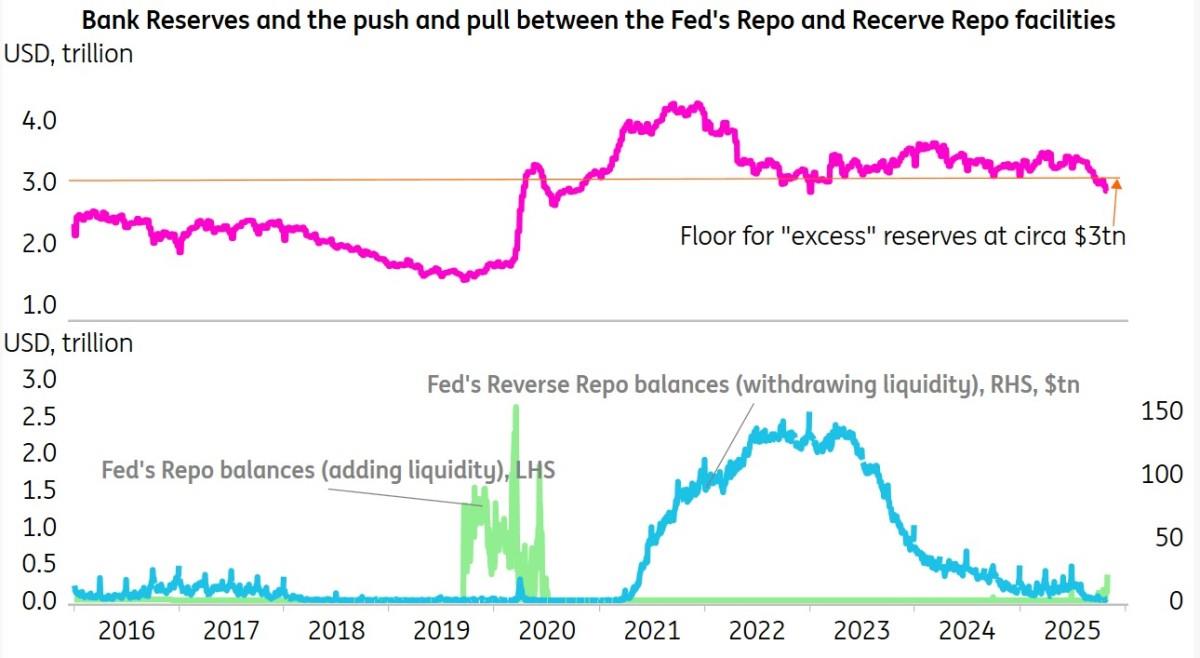
Source: Source: Macrobond, ING estimates Bank reserves now in a balanced position, and set to rise ahead
Source: Source: Macrobond, ING estimates
Source: Source: Macrobond, ING estimates Commercial paper versus the Fed's reverse repo rate
Source: Source: Macrobond, ING estimates With the Fed still expected to cut, terming out comes with lower rates
SLR adjustments in the coming months need to be monitored too
The Federal Reserve now plans to buy T-bills more actively as a means of adjusting reserves. This makes sense and aligns with our thinking. Fed officials will allow the MBS roll off to continue, offset by buying T-bills, leaving the overall impact on bank reserves balanced. That also allows it to increase reserves through T-bill buying if needed, just as it did in 2019 when things got tight. There is plenty of ammunition to do so as T-bill holdings are puny right now ($195bn). MBS continues to roll off, albeit very slowly. The pace has been running at $15-20bn per month. The balancing factor here is the buying of T-bills – that's what keeps the balance sheet from shrinking.
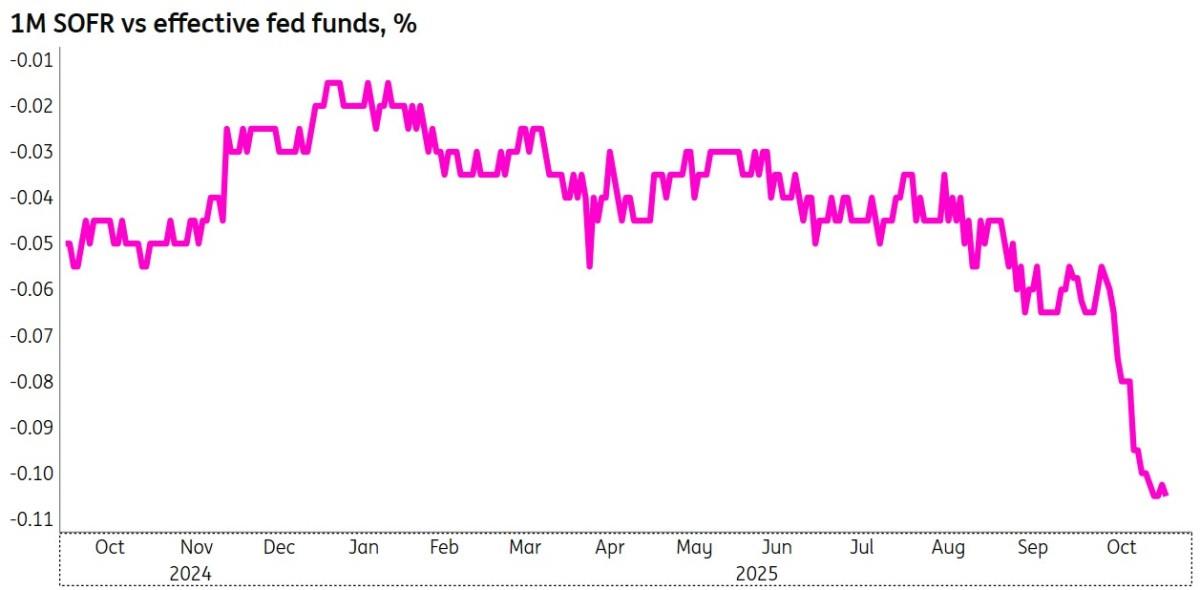
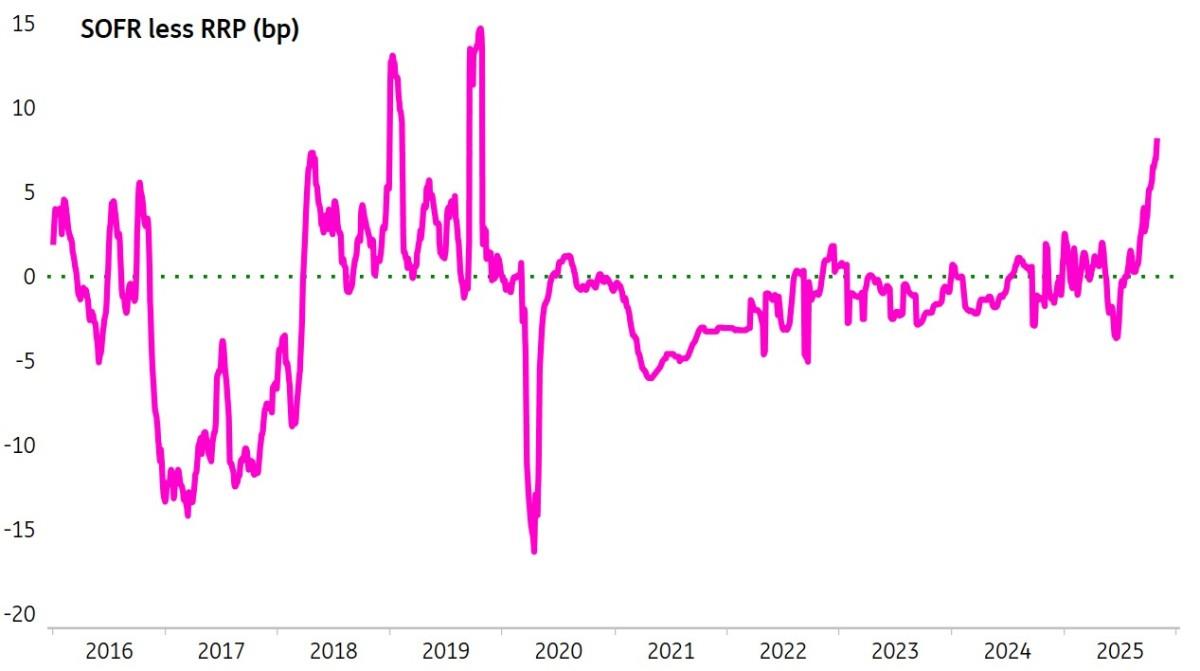
The backstory involves prior heavy net issuance of bills, which has been affecting money market conditions. The Treasury's cash balance has continued to grow, while its reserves declined. Repo has been tightening up, and the funds rate has risen, partly due to competition among the various places where players can place cash. Additionally, not all players have access to all liquidity buckets. Ultimately, it's a relative-value trade. Upside pressure on repo – and, by extension, secured overnight financing rate (SOFR) – is presenting a tempting bucket for liquidity. The explosion of the effective funds rate to SOFR presents the clearest manifestation of this (chart below).
Spike in repo versus the funds rate is a reflection of tightnessThe chart shows the spread from 1mth funds rate to SOFR (%)
Source: Source: Macrobond, ING estimates Bank reserves now in a balanced position, and set to rise ahead
That said, the reserves position looks broadly balanced as is. The Fed is neither providing nor withdrawing liquidity from the system to any significant extent. However, Fed Chair Powell did point to the gradually increasing use of the repo facility (where the Fed provides liquidity to the system). Not large, but the beginning of some tightness (chart below).
Bank reserves dip below $3tr, now confirmed as a line in the sandThe second chart shows how much the Fed is providing to the system and how much it's taking out. It is balanced right now
The last time the Fed actively allowed bank reserves to fall was during the quantitative easing (QE) unwind – quantitative tightening (QT) – that finally concluded in 2019. In September of that year, the Fed discovered that it had gone too far. Bank reserves had been halved to $1.4tr by then, and at that month's end, there was a severe disruption as the market struggled to deal with a dearth of liquidity, manifesting in a huge spike in repo rates. The system basically haemorrhaged, partly driven by a relatively moderate corporate tax payment need of some $120bn. So what did the Fed do in response? It proceeded to rebuild bank reserves through repos, and ultimately by purchasing T-bills. That's the recipe: rebuild reserves if they're seen to be too low. The Fed has likely learnt from this experience.
The follow-on question is what level of bank reserves are comfortable? Far from perfect, but one thing we can do is make a judgment on reserves based on a percentage of GDP. In September 2019, that percent hit a low of 6.5%. That was forced back up towards 8% as the Fed rebuilt reserves. Calibrating this to today equates to a bank reserves balance of some $2.5tr (at 8%). Then 9% reserves would be $2.8tr, while 10% would be $3.1tr. Simplistically, if 8% is a floor, then 9% offers some comfort to that floor, while 10% is likely to be very comfortable. The current level of bank reserves is $2.8tr, so we're in that semi-comfort zone of 9% to 10% of GDP. Given the upward pressure on the effective funds rate and the generally tight repo market, it's likely that this type of level represents a floor, with the Fed more likely now to build reserves at least as fast as the expansion of nominal GDP (2-5% per annum).
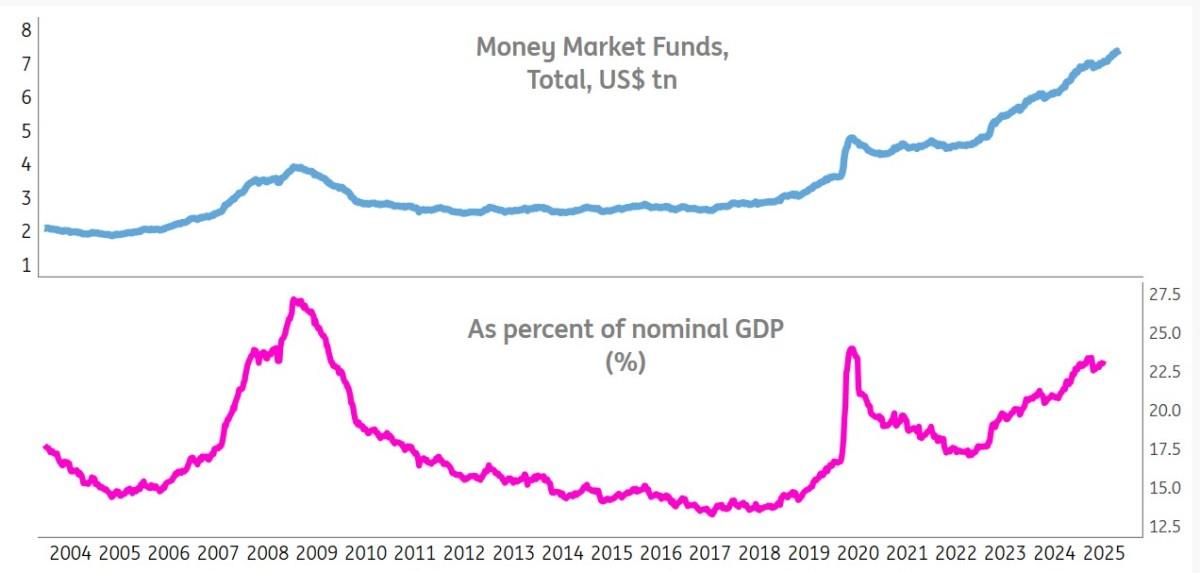
Money Market funds continue to attract lots of liqudity, now approaching $7.5trInflows to money market funds remain firm, with both institutional and retail participating. Prime funds continue to see their fair share of the increase. As a percentage of GDP, total money market funds are now approaching 24%, not far off the previous high of 27% in 2009 (chart below). So far, the rate-cut narrative has not been a material issue, mostly as a return of 4% still represents a decent return on what is effectively a 'zero risk' product.
Money Market funds approaching 24% of GDP, back towards historic highsThe top chart shows the absolute dollar amount, while the lower chart illustrates the same as a percentage of GDP
Source: Source: Macrobond, ING estimates
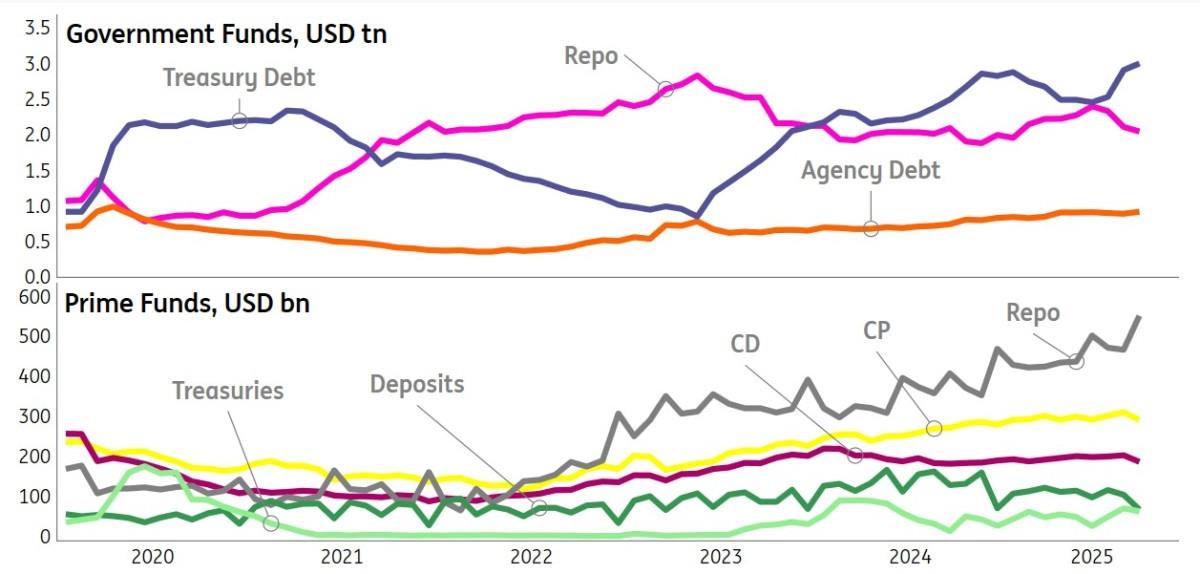
In terms of specific exposures, Government Funds have seen a renewed rise in holdings of Treasury Debt (effectively bills). Extra bills are being issued to take pressure off coupon issuance and to build up the cash balance at the Treasury after the rise in the debt ceiling, as part of the wider 'Big Beautiful Bill'. This should help maintain a concession in bills. Repo have been downsized relative to Bills' holdings as a result.
In Prime Funds, Repo (reflecting equity repo) exposures remain elevated. Exposure to commercial paper (CP) has been gradually rising, while certificates of deposit (CD) and ordinary deposits have been steadier to a tad lower. Bank deposits have been on the slide, mostly because there are better terms in alternative buckets.
The composition of investments in Money Market fundsThe top chart shows the breakout within government funds, while the lower chart shows how prime funds are internally apportioned.
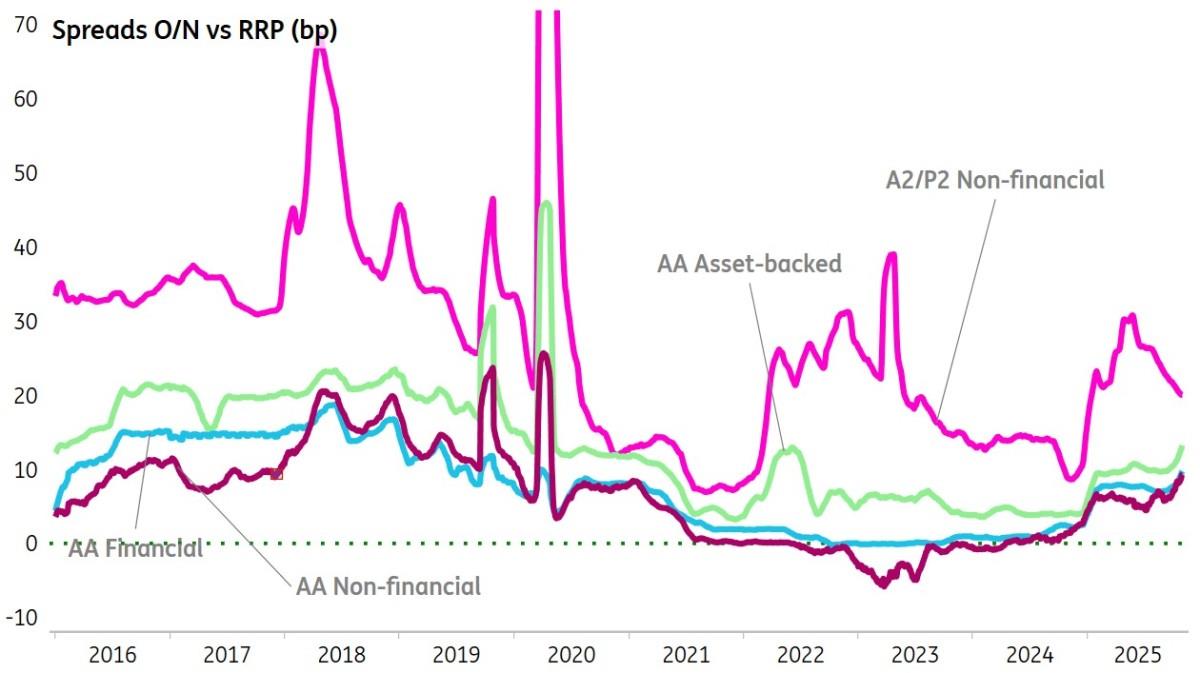
Source: Source: Macrobond, ING estimates Commercial paper versus the Fed's reverse repo rate
In terms of attainable rates, the entire spectrum of overnight commercial paper rates remains comfortably above the Federal Reserve's reverse repo rate. Initially, this was a reflection of the 5bp move down to the funds rate floor since the December FOMC meeting. More recently, it reflects the evolving tightness in repo, acting as an upward drag on other rates from a relative value perspective. A larger concession remains built into A2/P2 rates, but no more than the fair valuation of risk.
Commercial paper alternatives as spreads above the Fed's reverse repo rateThe relevance of the Fed's reverse repo facility has been downsized significantly from a relative value perspective, as better repo terms are now typically attainable on the market. The reverse repo window will continue to be accessed primarily around quarter (and month) ends, as counterparties turn to the Fed's facility to bridge liquidity gaps driven by regulatory window dressing requirements. But effectively, this bucket has been wound down towards zero as liquidity excesses are fully unwound. An extra push of late has come from the elevation of market repo versus the Fed's reverse repo rate (chart below).
Spread from the Fed's reverse repo rate to SOFR – spike!We expect this to calm back down, especially post the December FOMC outcome.
Source: Source: Macrobond, ING estimates With the Fed still expected to cut, terming out comes with lower rates
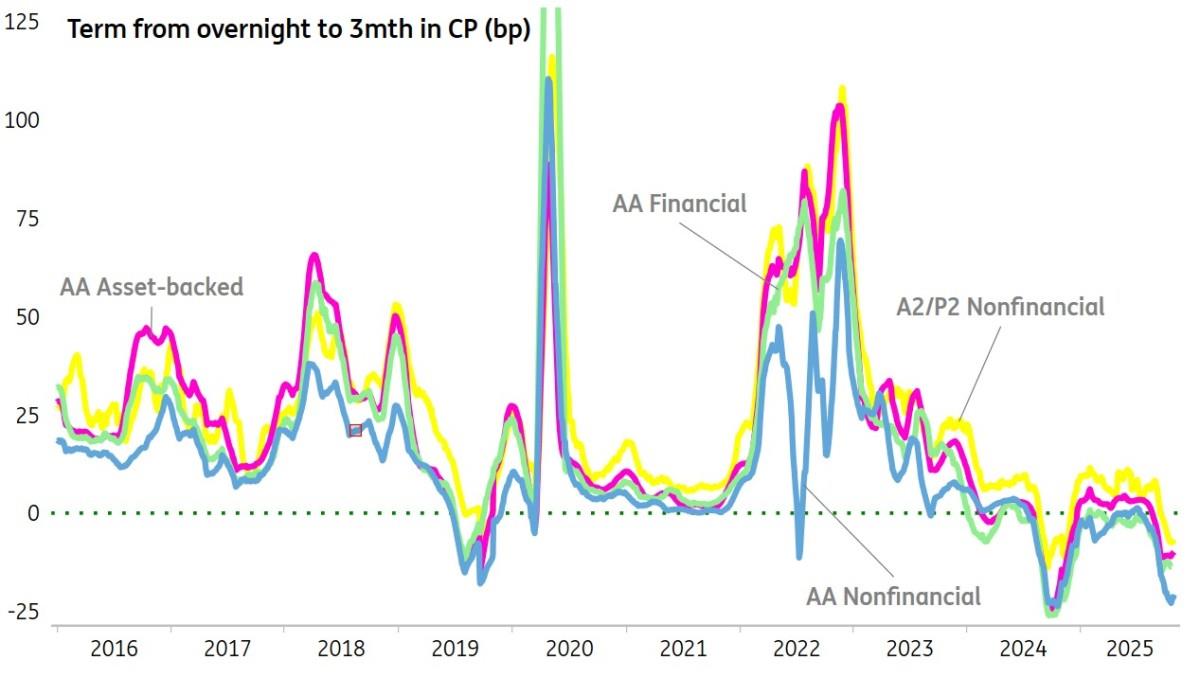
With the Fed still technically in rate-cutting mode, terming out tends to net an absolute rate concession. But there is still value in terming out as a means of locking in currently attainable rate levels, which tend to underrepresent the full extent of likely cuts on a 12-month horizon.
We expect the Fed to cut by 75bp in the coming six to 12 months. A December cut is up in the air. Powell has no problem leaving the funds rate unchanged at the December meeting, if that is deemed the thing to do. It comes with residual comfort in the economy. The fact that a 4.3% unemployment rate was specifically referenced as "low" amplifies this point. Instead, there is a degree of discomfort with inflation running at 3%, and likely heading higher.
At the same time, there has not been a material change in the ultimate landing level for the funds rate. It's now slightly above 3%, but still within the 3% range. And the 5yr rate continues to trade below the straight line that can be drawn between the 2yr and 10yr rates in a steady fashion. This signals an unwavering expectation that the Fed is, in fact, far from done – it's just a matter of timing.
Terming out from Overnight to 3mth Commercial PaperSLR adjustments in the coming months need to be monitored too
As an important aside, proposed changes to the Supplementary Leverage Ratio (SLR) for big US banks can boost demand for Treasuries and Repo. That said, banks won't rush to buy. A skew on balance sheets is more likely to be gradual. Banks are lenders first, and credit hasn't been notably constrained, especially with high reserves.
Is this impactful for Repo? We think so, yes. In fact, we suspect we need an easing in the SLR to really calm things down. Most players have easy access to liquidity, but from time to time there are liquidity shortages. It's a bit phoney as there is ample liquidity in the system. However, those holding the liquidity often don't want to, or cannot, participate. Ease the SLR and that can change.
See more here.

Legal Disclaimer:
MENAFN provides the
information “as is” without warranty of any kind. We do not accept
any responsibility or liability for the accuracy, content, images,
videos, licenses, completeness, legality, or reliability of the information
contained in this article. If you have any complaints or copyright
issues related to this article, kindly contact the provider above.
Most popular stories
Market Research

More Story


Comments
No comment