403
Sorry!!
Error! We're sorry, but the page you were looking for doesn't exist.
GBP/USD Signal 03/11: Supertrend Points To Crash (Chart)
(MENAFN- Daily Forex) Bearish View
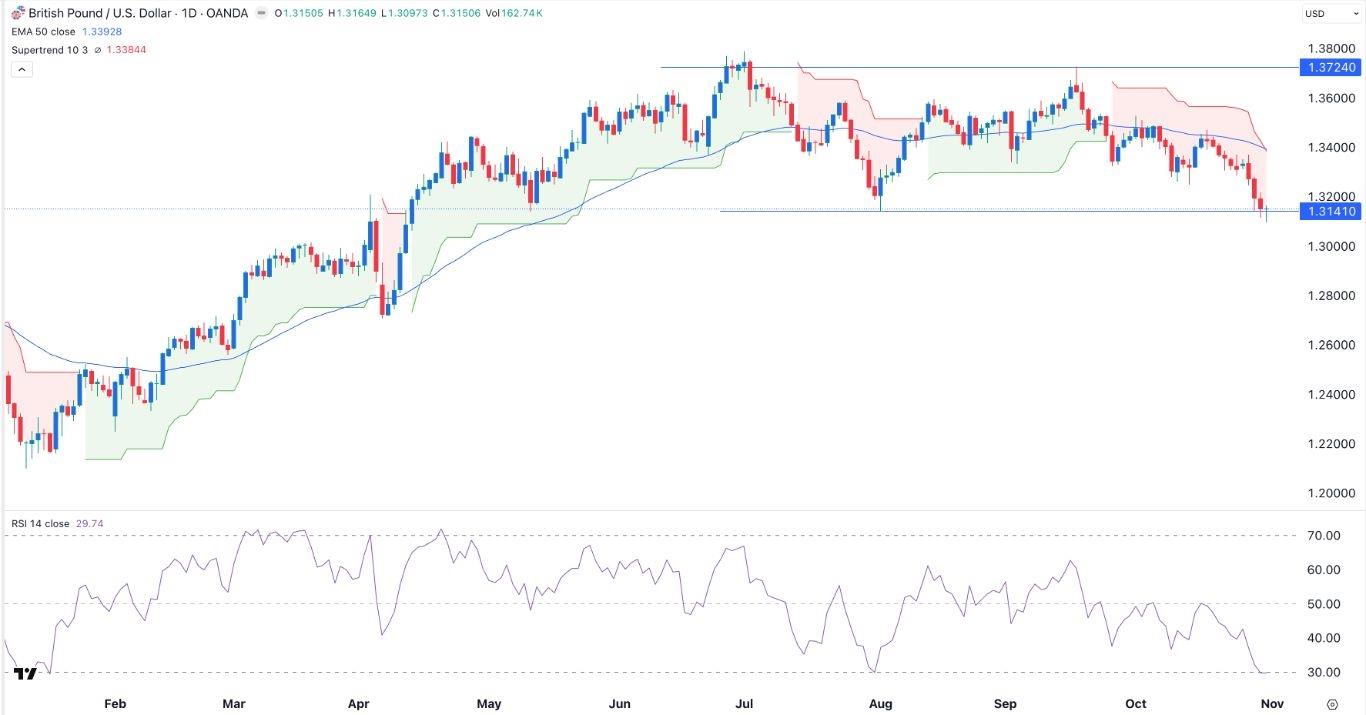
- Sell the GBP/USD pair and set a take-profit at 1.3000. Add a stop-loss at 1.3250. Timeline: 1-2 days.
- Buy the GBP/USD pair and set a take-profit at 1.3250. Add a stop-loss at 1.3000.
Economists expect the bank to leave interest rates unchanged and possibly point to a cut in December. The other top macro data to watch from the UK will be the manufacturing and services PMIs and housing numbers.
EURUSD Chart by TradingViewGBP/USD Technical AnalysisThe daily chart shows that the GBP/USD pair has moved downwards in the past few months. It has dropped from a high of 1.3724 in September to the current 1.3140.The pair has moved below the 50-day Exponential Moving Average. Also, the Relative Strength Index (RSI) has moved to the oversold level of 30.Sterling has also moved below the Supertrend and the Ichimoku cloud indicator. Therefore, the path of the least resistance is bearish, with the next key point to watch being the psychological point at 1.3000. A move above the resistance level at 1.3250 will invalidate the bearish outlook.Ready to trade our free trading signals? We've made a list of the best UK forex brokers worth using.
Legal Disclaimer:
MENAFN provides the
information “as is” without warranty of any kind. We do not accept
any responsibility or liability for the accuracy, content, images,
videos, licenses, completeness, legality, or reliability of the information
contained in this article. If you have any complaints or copyright
issues related to this article, kindly contact the provider above.


Comments
No comment