403
Sorry!!
Error! We're sorry, but the page you were looking for doesn't exist.
BTC/USD Forex Signal 21/10: Price May Crash Again (Chart)
(MENAFN- Daily Forex) Bearish view
- Sell the BTC/USD pair and set a take-profit at 103,350. Add a stop-loss at 115,000. Timeline: 1-2 days.
- Buy the BTC/USD pair and set a take-profit at 115,000. Add a stop-loss at 103,500.
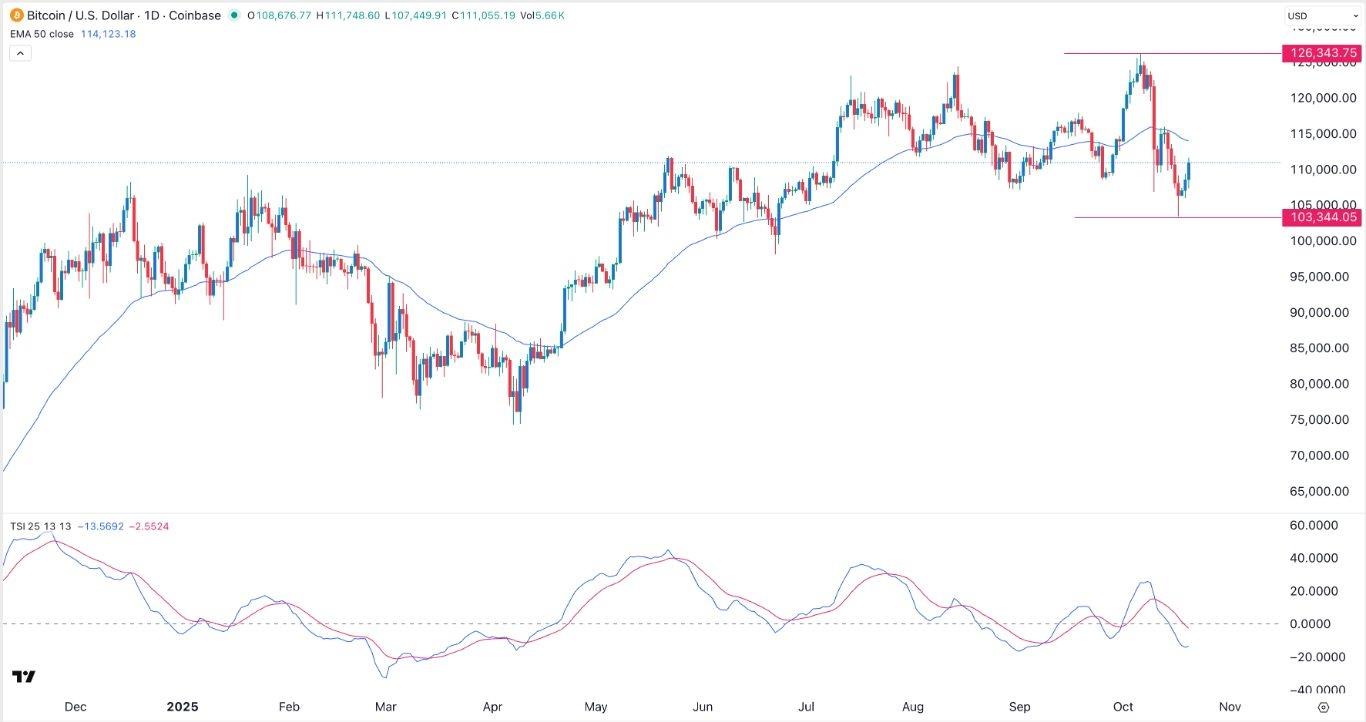
Additionally, the BTC/USD pair rose as investors bought the recent dip as evidenced by Monday's ETF inflows. Still, the main risk is that the ongoing rise is part of a dead-cat bounce, a situation where an asset rebounds temporarily and then resumes the downtrend.
EURUSD Chart by TradingViewBTC/USD Technical AnalysisThe daily timeframe chart shows that the BTC/USD pair peaked at 126,343 earlier this month and then bottomed at 103,344.It then formed a morning star candlestick pattern, which is a common bullish reversal sign. This candle is made up of a body and small upper and lower shadows.The risk, however, is that the pair remains below the 50-day Exponential Moving Average, a sign that bears are still in control. Also, the True Strength Index, which measures the strength of a trend, has moved below the zero line and is pointing downward.Therefore, the pair will likely resume the downward trend and possibly retest this month's low of 103,345. A move below that level will point to more downside, potentially to 100,000.Ready to trade our daily Forex signals? Here's a list of some of the best crypto brokers to check out.
Legal Disclaimer:
MENAFN provides the
information “as is” without warranty of any kind. We do not accept
any responsibility or liability for the accuracy, content, images,
videos, licenses, completeness, legality, or reliability of the information
contained in this article. If you have any complaints or copyright
issues related to this article, kindly contact the provider above.


Comments
No comment