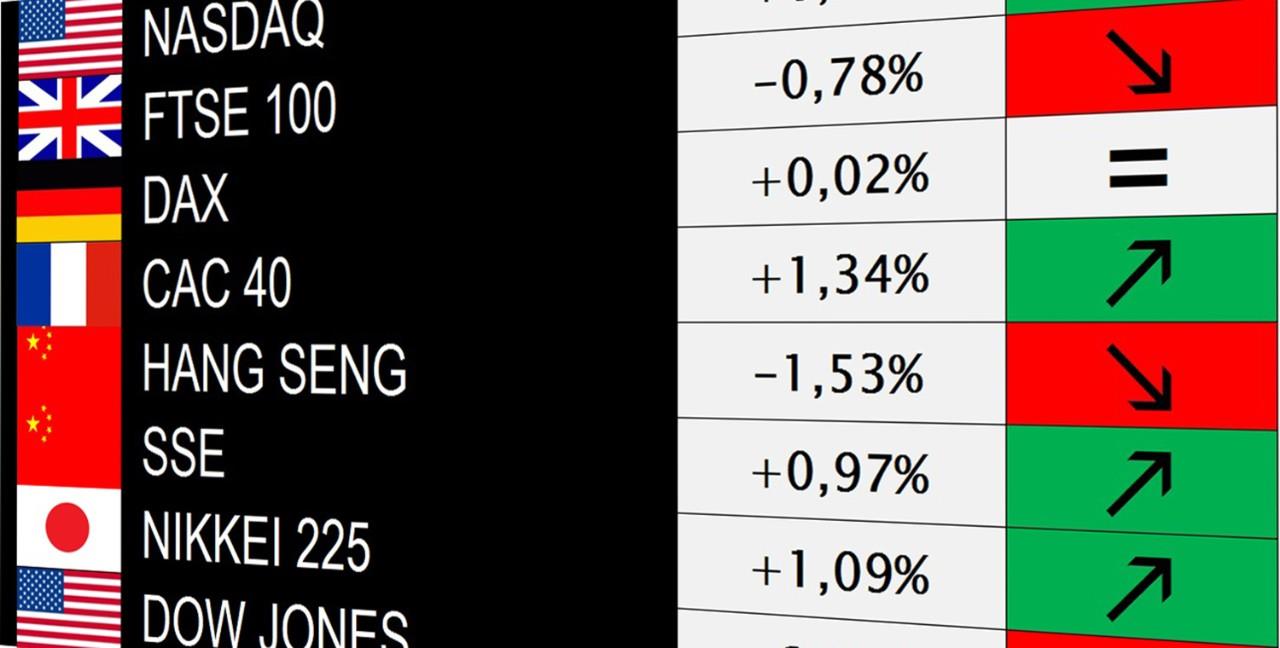
European Indices Hold Steady Ahead Of PMI And Bank Speeches
European equity markets began the week on a mixed note, with investors taking a cautious stance ahead of key purchasing managers' index (PMI) data and speeches from officials at the United States (US) Federal Reserve and the Bank of England (BoE) that could provide insight into policy directions for the remainder of the year.
The DAX 40 continued its recent underperformance, falling 0.48% to 23,527, while the FTSE 100 eked out a modest 10-point gain to finish at 9226. The gain in the FTSE follows the BoE's decision last week to keep the official bank rate unchanged at 4% and where it emphasised inflation risks without expressing significant concerns about the labour market softening.
Tonight, attention shifts to BoE Chief Economist Huw Pill's speech, following the release of the United Kingdom (UK) flash PMI data, previewed below.
UK composite PMIDate: Tuesday 23 September at 6.30pm AEST
The UK composite PMI for September is expected to ease to 53 from 53.5 previously, marking the fifth month of expansion.
A projected dip in services to 53.5 from 54.2 is expected to be offset by a modest rebound in manufacturing to 47.1 from 47.
UK composite PMI chart Source: TradingEconomics Source: TradingEconomics FTSE 100 technical analysisLate August, the FTSE hit a fresh record high of 9357, which it retested in mid-September, before falling back towards 9200 - a level it has spent the past four sessions glued to as part of a correction.
A sustained break above the 9357 record high would indicate the correction is complete and the uptrend has resumed, with scope towards 9500.
However, as long as the FTSE remains below the 9357 record high, there is the potential for a dip back to 9100 as part of a sideways correction. If the support at 9100 were to fail, it would pave the way for a deeper decline towards the psychologically important 9000 support level .
FTSE 100 daily candlestick chart Source: TradingView Source: TradingView DAX 40 technical analysisAfter a strong rally from the April low of 18,489 to the July high of 24,639, the DAX has spent the past two and a half months consolidating those gains.
If the DAX were to see a sustained break above initial resistance at 24,000 and then above the 24,450 to 24,650 resistance zone , it would signal that the correction is complete and that the uptrend has resumed towards 25,000.
Until then, the expectation is for the DAX to continue consolidating the gains made between April and June. As part of this, a dip back to support at 23,000 to 22,750, which includes the 200-day moving average , is possible.
DAX 40 daily candlestick chart Source: TradingView Source: TradingView-
Source: TradingView. The figures stated are as of 23 September 2025 . Past performance is not a reliable indicator of future performance. This report does not contain and is not to be taken as containing any financial product advice or financial product recommendation.
This information has been prepared by IG, a trading name of IG Markets Limited. In addition to the disclaimer below, the material on this page does not contain a record of our trading prices, or an offer of, or solicitation for, a transaction in any financial instrument. IG accepts no responsibility for any use that may be made of these comments and for any consequences that result. No representation or warranty is given as to the accuracy or completeness of this information. Consequently any person acting on it does so entirely at their own risk. Any research provided does not have regard to the specific investment objectives, financial situation and needs of any specific person who may receive it. It has not been prepared in accordance with legal requirements designed to promote the independence of investment research and as such is considered to be a marketing communication. Although we are not specifically constrained from dealing ahead of our recommendations we do not seek to take advantage of them before they are provided to our clients. See full non-independent research disclaimer and quarterly summary .
Ready to open an IG account?
Start your trading journey now
Open a free demo accountChapters
X UK Composite PMI FTSE 100 technical analysis DAX 40 technical analysis
Legal Disclaimer:
MENAFN provides the
information “as is” without warranty of any kind. We do not accept
any responsibility or liability for the accuracy, content, images,
videos, licenses, completeness, legality, or reliability of the information
contained in this article. If you have any complaints or copyright
issues related to this article, kindly contact the provider above.
Most popular stories
Market Research

- Schoenherr Welcomes Top-Tier CEE English Law Debt Finance Team
- Edgen And Sahara AI Announce Strategic Collaboration To Pioneer Decentralized Validation In Market Intelligence
- 1Inch Unlocks Access To Tokenized Rwas Via Swap API
- Leverage Shares Launches First 3X Single-Stock Etps On HOOD, HIMS, UNH And Others
- Kucoin Partners With Golf Icon Adam Scott As Global Brand Ambassador
- Bitcoin Adoption On Sui Accelerates As Threshold Network And Sui Launch Phase 2 Of Tbtc Integration


Comments
No comment