USD/ZAR Analysis 22/09: Boomerang Values (Chart)
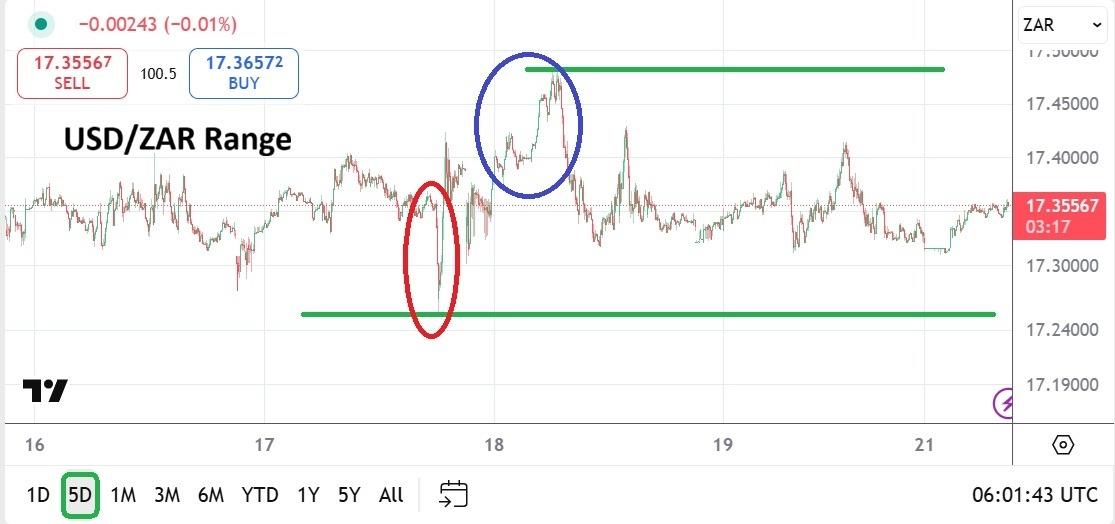
While the Fed certainly cut its interest rate last week, the move was anticipated, meaning it was priced into the USD/ZAR before the announcement. The USD/ZAR hit a low via a spike, but the move higher showed that financial institutions understood they are essentially back to testing a known realm in the currency pair. Big traders will still want more impetus to create a new value range.
EURUSD Chart by TradingViewConsolidation and Near-Term TradingSince the 11th of September the USD/ZAR has shown an ability to trade below the 17.40000 ratio rather well.- Day traders may be intrigued by the thought the USD/ZAR can go lower, durable support stands in the way however. Perhaps for the moment it will be wise to merely test support and resistance levels between 17.31000 to 17.36000 for quick hitting speculative attempts. U.S GDP data will be released this coming Thursday and Friday will see an important inflation report. Until these two reports are released, financial institutions will likely test their short-term sentiment within the known range which has been rather steady the past week.

Legal Disclaimer:
MENAFN provides the
information “as is” without warranty of any kind. We do not accept
any responsibility or liability for the accuracy, content, images,
videos, licenses, completeness, legality, or reliability of the information
contained in this article. If you have any complaints or copyright
issues related to this article, kindly contact the provider above.


Comments
No comment