BTC/USD Forex Signal 10/09: Cusp Of Bearish Breakout (Chart)
(MENAFN- Daily Forex) Bearish view
- Sell the BTC/USD pair and set a take-profit at 107,000. Set a take-profit at 115,000. Timeline: 1-2 days.
- Buy the BTC/USD pair and set a take-profit at 115,000. Add a stop-loss at 107,000.
It is a sign that there is demand for Bitcoin and other top cryptocurrencies. Data shows that the spot Bitcoin ETFs have had over $54 billion in inflows, bringing the total assets in its platform to $145 billion.
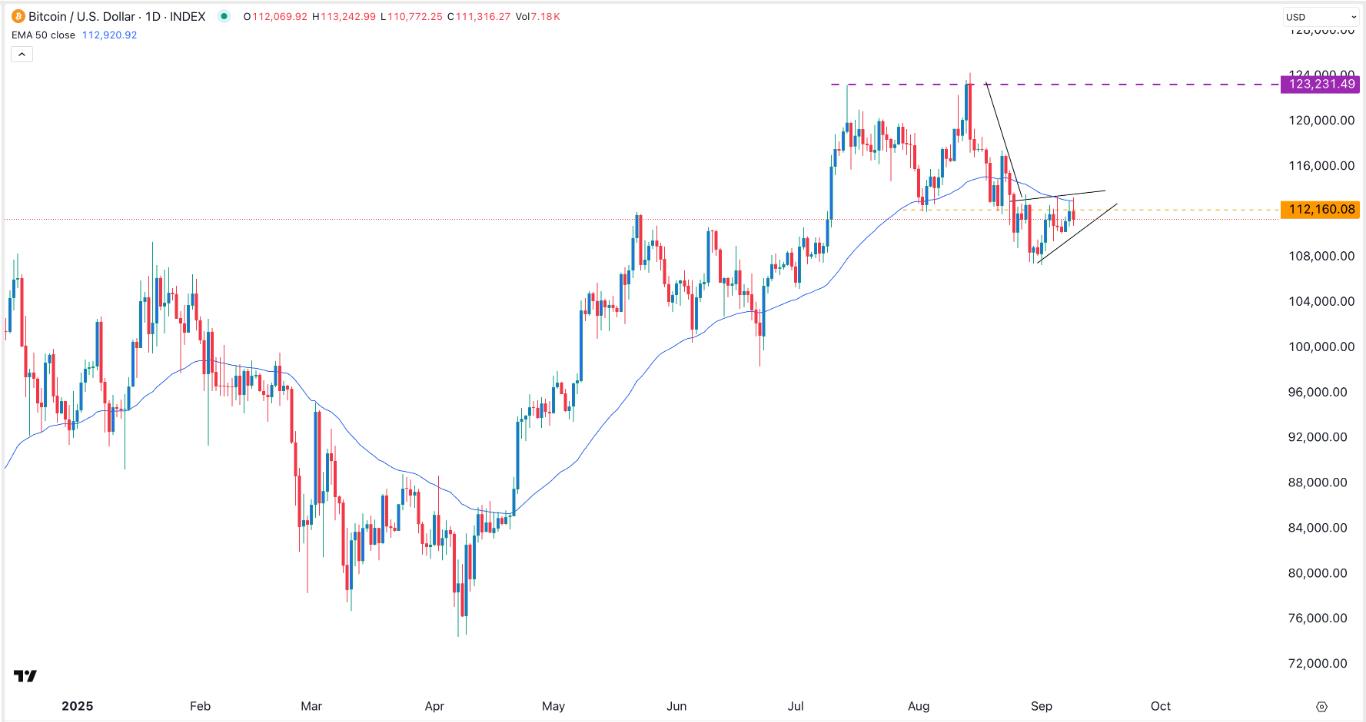
EURUSD Chart by TradingViewBTC/USD Technical AnalysisThe daily timeframe chart shows that the BTC/USD pair has remained under pressure in the past few days. It has dropped from the year-to-date high of 124,250 to the current 112,000.The current price is notable because it is along the neckline of the double-top pattern point at 123,230. It is also in the process of forming a bearish flag pattern, a popular continuation pattern.The BTC/USD pair has remained below the 50-day Exponential Moving Average (EMA). Therefore, the most likely scenario is where the pair continues falling, with the initial target being last month's low of 107,330. A move below that level will point to more downside to 105,000.Ready to trade our free Forex signals ? Here are the best MT4 crypto brokers to choose from.
Legal Disclaimer:
MENAFN provides the
information “as is” without warranty of any kind. We do not accept
any responsibility or liability for the accuracy, content, images,
videos, licenses, completeness, legality, or reliability of the information
contained in this article. If you have any complaints or copyright
issues related to this article, kindly contact the provider above.
Most popular stories
Market Research

- Kucoin Presents Kumining: Embodying Simple Mining, Smart Gains For Effortless Crypto Accumulation
- BILLY 'The Mascot Of BASE' Is Now Trading Live On BASE Chain
- Primexbt Launches Empowering Traders To Succeed Campaign, Leading A New Era Of Trading
- United States Animal Health Market Size, Industry Trends, Share, Growth And Report 2025-2033
- United States Lubricants Market Growth Opportunities & Share Dynamics 20252033
- Japan Buy Now Pay Later Market Size To Surpass USD 145.5 Billion By 2033 CAGR Of 22.23%


Comments
No comment