(MENAFN- Daily Forex) Forex Brokers We Recommend in Your Region See full brokers list 1 ![brkr-logo]() read full review get started
read full review get started
Bullish view Buy the btc/usd pair and set a take-profit at 31,000. Add a stop-loss at 29,000. Timeline: 1-2 days.
Bearish view Set a sell-stop at 29,400 and a take-profit at 28,500. Add a stop-loss at 31,000.
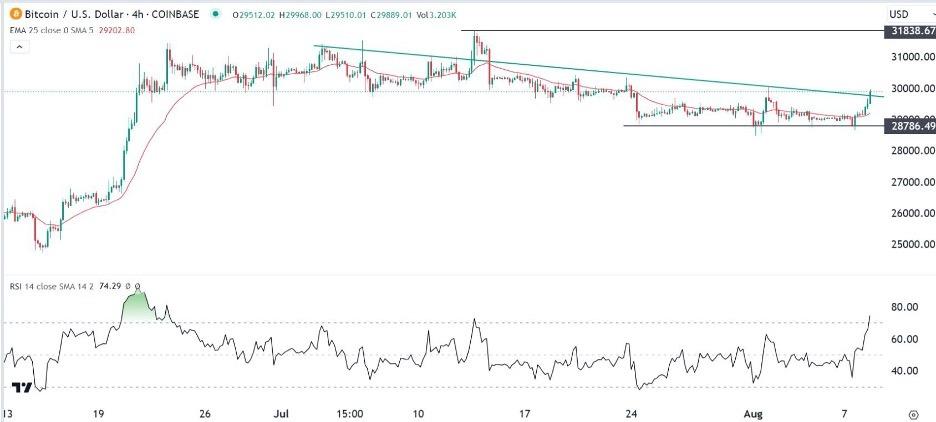
The BTC/USD pair and American equities diverged as concerns about the banking sector continued. Bitcoin jumped to $30,000 for the first time since August 2nd while the Dow Jones and the Nasdaq 100 indices dropped by over 1%.Bond yields plungedThe BTC/USD pair rose after the relatively weak economic numbers from China. The data revealed that the country's export and imports dropped sharply in July. They have all dropped in the past seven months, pointing to more weakness of the economy. In a note, analysts at JP Morgan slashed China's GDP to 5.0%.As a result, American bond yields dropped sharply. The ten-year bond yield dropped by 1.25% to 4.026% while the 30-year fell by 1.45% to 4.19%. This price action also happened as a risk-off sentiment spread in the market. This sentiment pushed the US dollar index (DXY) and the VIX index sharply higher.The dollar index rose by 50 basis points while the VIX index rose to $16.60. At the same time, key indices like the Nasdaq 100 and the S&P 500 retreated by over 1%. Investors are concerned about the country's banking sector after Moody's slashed ratings of key American banks. Bitcoin tends to rise when challenges in the banking sector emerge. It rose in the first quarter after the collapse of companies like Signature Bank and Silicon Valley Bank.The BTC/USD pair also jumped after more mainstream companies entered the crypto industry. In a statement on Monday, PayPal launched a new stablecoin. It joined other companies like Blackrock and Invesco that have applied for their spot ETFs.BTC/USD technical analysis The 4H chart shows that the BTC/USD pair found strong support at 28,766. It first dropped to this level on July 24th and failed to move below it several times. This is a signal that crypto investors are afraid of moving below that support level.The BTC/USD pair rose above the 25-period moving average and the descending trendline is shown in green. That trendline connects the highest points on July 3rd and July 23rd July. The Relative Strength Index (RSI) has moved to the overbought level.Therefore, the pair will likely continue rising, with the next resistance level to watch will be at 31,000. The stop-loss of this trade will be at 29,000.Ready to trade our free daily forex trading signals ? We've shortlisted the best mt4 crypto brokers in the industry for you.
MENAFN09082023000131011023ID1106819744
Legal Disclaimer:
MENAFN provides the
information “as is” without warranty of any kind. We do not accept
any responsibility or liability for the accuracy, content, images,
videos, licenses, completeness, legality, or reliability of the information
contained in this article. If you have any complaints or copyright
issues related to this article, kindly contact the provider above.


Comments
No comment