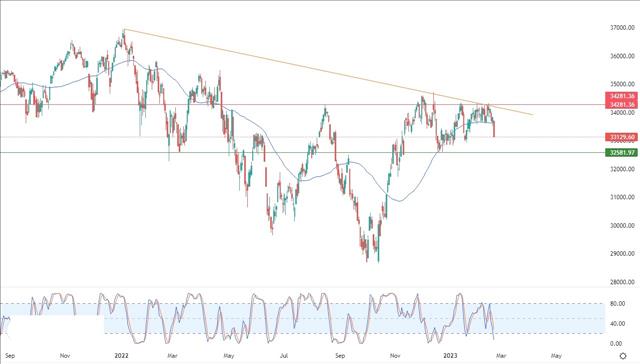
(MENAFN- Daily Forex) The dow jones Industrial Average slid down during its recent trading on intraday levels, to incur sharp losses in its last session by -2.06%. The index lost about -697.10 points, to settle at the end of trading at the level of 33,129.60. It recorded its worst day in percentage terms since December 15, 2022. This comes after it achieved gains during trading on Friday, amounting to 0.39%, at the end of a week in which it recorded losses of -0.13%. It recorded the longest series of weekly losses since September, to erase the index, with its recent decline, almost all of its gains during the new year.
Advertisement take advantage of today's market opportunities start trading now
In the latest economic data on Tuesday, the services PMI FLAS, which hit an 8-month high in February at 50.5 up from 46.8 the previous month, and the US manufacturing PMI rose to a four-month high. at 47.8, up from 46.9.
The data also showed existing home sales fell to the lowest point in a decade. The 0.7% decline in January was the 12th consecutive monthly decline, according to National Association of Realtors figures.
The new data added to a recent set of economic data that painted a picture of a strong economy. The economy continues to be strong and steady on the back of multiple interest rate increases by the central bank in 2022 aimed at curbing inflation.
With inflation still far from the Fed's 2% target and the economy retaining plenty of steam, money market participants have been adjusting their expectations for the peak rate hike. Currently, it sees its peak at 5.35% in July and remains near those levels throughout the year.
Looking ahead, investors will look to the minutes detailing the discussion at the Federal Reserve's latest policy meeting due later on Wednesday, for more clues about attitudes within the central bank on interest rates.Dow Jones Technical Analysis
Technically, the index surpassed, with its recent decline, the support of its simple moving average for the previous 50-day period, thus missing the last positive opportunity that could have helped it to rise.
This happened amidst the abundance of negative signals in the relative strength indicators and considering its trading along a major bearish trend line in the medium term, just as it is shown in the attached chart for a period of time (daily).
Therefore, our expectations indicate a further decline for the index during its upcoming trading, as long as the pivotal 34,281.36
resistance level remains intact, to target the support level at 32,582.
Ready to trade the us 30 ? We've made a list of the best cfd brokers worth trading with.


Comments
No comment