


403
Sorry!!
Error! We're sorry, but the page you were looking for doesn't exist.

Credit: Our View On Defaults & Leverage
(MENAFN- ING)
ING, Macrobond
ING, S&P

ING, S&P
ING, ICE, Refinitiv
All-in cost has risen substantially - BB
ING, ICE, Refinitiv
Default rates expected to rise to 4.5-5.0%
ING, ICE, Moody's
ING, ICE, Moody's
Inflation, rising energy prices, recession and higher funding costs are all contributing to a perfect storm where corporate margins and earnings will undoubtedly be put under pressure. Currently, leverage metrics are strong and stable with corporates holding plenty of cash on balance sheets, but we fear this may deteriorate in the coming months.
As such we expect to see more weakness and volatility for credit markets ahead. Worsening fundamentals should theoretically lead to more widening of spreads, but with current elevated spread levels it will ultimately create even more value into credit. Nonetheless, we do forecast a notable increase in default rates, expected to approach 4.5-5.0% in both Europe and the US.
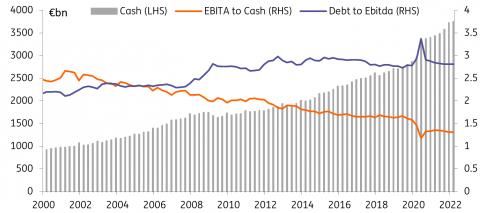
Leverage could worsen as recession pressures earningsLeverage metrics have remained rather steady over the past number of quarters. However, we expect metrics could worsen in the coming months as margins decrease (pricing power in passing on higher costs to consumers starts to falter) and earnings see pressure from a more severe recessionary environment. However, in saying that, there is still significant levels of cash on corporate balance sheets. This is on the back of substantial precautionary funding done during the last couple of years, in combination with a very low amount of capex (both Covid induced). As illustrated below, cash has increased considerably compared to EBITA numbers. This certainly contributes towards a buffer for potential headwinds approaching. The perfect storm though of inflationary pressures, rising energy prices, supply chain effects, and recession effects will all put pressure on margins and thus earnings eventually.
Significant cash on balance sheets of European corporatesING, Macrobond
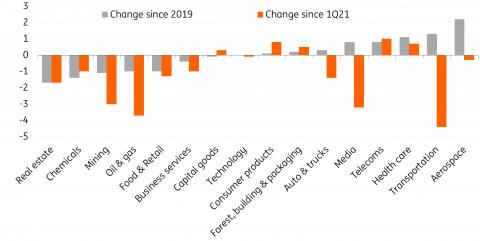
Looking at the change in net debt to EBITDA numbers on a sector basis as illustrated below, it shows leverage is mostly lower since 1Q21, with the exception of some sectors namely Consumers, Telecoms and Healthcare. The change in leverage since 2019 is varied with some sectors showing improved metrics while others are worsening.
Leverage trends per sectorING, S&P
The chart below then takes the forecasted leverage for each sector for 2023 into account based off four scenarios laid out by S&P:
- Base Case
- Mid-cycle dip
- Mild Recession
- Full Recession
Somewhere between a mild recession and a full recession is in line with the thinking of our own macro-economic experts. Hence when analysing the chart below we look at the difference between the forecasted mild and full recession levels compared to 2019. Thus any sector that has a forecasted leverage below the 2019 level could be considered better set to weather the storm, while any sector that has a higher leverage forecasted above the 2019 level has more of a likelihood to underperfom.
Leverage forecasts per sectorING, S&P
Oil & Gas , Mining and Telecoms are best suited to weather the storm in terms of leverage metrics, according to S&P. Both Oil & Gas and Mining have indeed seen improved metrics in the past years, but Telecoms have been worsening.
Media , Autos and Transportation have all seen significant improvement in metrics since 1Q21, but are still worse off compared to 2019. Transport may fair okay in the case of a mild to full recession, pencilling in closer to 2019 levels. But Media and particularly Autos are likely to see an increase in leverage above 2019 levels.
Capital goods , Technology , Chemicals and Healthcare saw elevated leverage metrics in 2019, thus the forecasts for the mild to full recession are rather close to these levels.
Construction , Retail , Consumers and Autos are set to see the most significant rise in leverage relatively in the case of a mild to full recession.
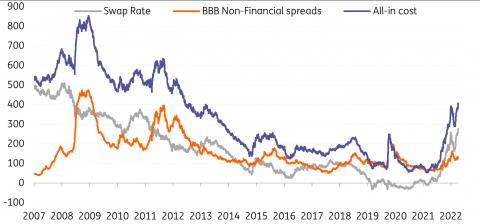
Higher swap rates and wider spreads increases cost of debtWe expect spreads to widen further from here as inflation remains high, and central banks continue their tapering and rate hiking, although spreads should remain in the trading range of 84bp-104bp for non-financials and 100bp-125bp for financials. In the case of a more significant recession we may see spreads widen more substantially through the range, and these could approach the wide levels hit back in early July (125bp for non-financials and 140bp for financials).
The all-in cost of debt has risen rather significantly in recent months with both spreads widening and swap rates rising. Thus corporates can no longer avail of cheap funding.
All-in cost has risen substantially - BBBING, ICE, Refinitiv
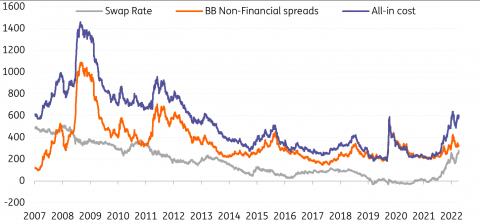
All-in cost has risen substantially - BB
ING, ICE, Refinitiv
Default rates expected to rise to 4.5-5.0%
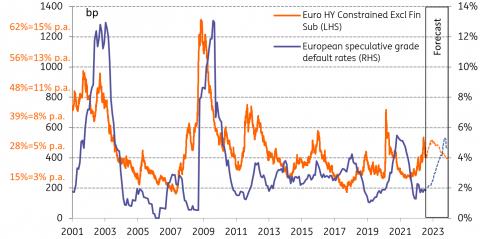
When looking at the relationship between spreads and defaults, we observe a rather strong correlation with increasing default rates and widening spreads, albeit there is a delay. The most recent spread widening, alongside the expected widening of spreads from here, suggest default rates will rise in the coming months. Additionally, recessionary factors will also put pressure on corporates, particularly with much higher funding costs.
The two figures below show the theoretical compensation for these spreads on the basis of loss given default calculations assuming a 40% recovery rate (ie, how high should credit spreads need to be to compensate for certain cumulative or annual default rate).
EUR default rates up against HY spread developments with implied default ratesING, ICE, Moody's
Using the Euro High Yield index with a spread level at 418bp, the 1yr implied default rates is 5.6%, with a 5yr default rate of 28.8%
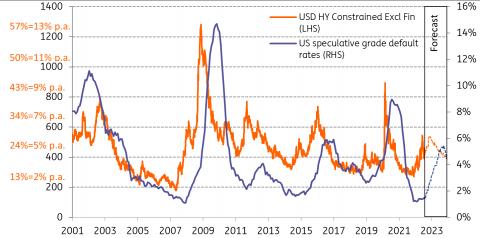
USD default rates up against HY spread developments with implied default ratesING, ICE, Moody's
Similarly, using the USD High Yield index with a spread level of 423bp, the 1yr implied default is computed at 4.9%, with a 5yr implied default of 25.5%. US default rates increasing towards 4.5-5.0% is relatively lower compared to previous elevated default rate levels. This is an indication of the difference between EUR and USD, as the effects of the crisis are less significant in the US than Europe.
S&P forecast 5.0% default rate under Pessimistic ScenarioS&P breaks down three scenarios for the coming year and have subsequently three default rate forecasts:
- Optimistic Scenario: Involves a resolution to Ukraine-Russia conflict, cooling inflation and stable economic condition. Here they forecast a 1.25% default rate
- Base Scenario: Stress lingers in the economy putting pressure on earnings and the European Central Bank continues to raise rates. Here they forecast a 3.0% default rate
- Pessimistic Scenario: Greater challenge in recessionary environment, as inflation remains high, and the ECB continues to raise rates. Here they forecast a 5.0% default rate.
We feel the economic environment has changed since S&P published these scenarios on 22 August, and titled towards their pessimistic scenario. S&P also acknowledged that“the default tally could overshoot that forecast if pressure on profits mounts further, or if issuers fail to refinance debt in a timely manner due to unreceptive and expensive debt primary markets”.
Moody's forecast 6.5% under Moderately Pessimistic ScenarioMoody's breaks down four scenarios for the coming year and have subsequently four default rate forecasts:
- Base Scenario: Growth slows but with no recession, while monetary policy curbs inflation. Here they forecast European default rates at 3.3%
- Moderately Pessimistic Scenario: Russia-Ukraine conflict persists alongside a recessionary environment and persistent high inflation. In addition they see Covid cases rise. Here they forecast 6.5% default rates
- Severely Pessimistic Scenario: Much more severe recession with high inflation. The war in Ukraine escalates beyond Ukraine's borders. A major resurgence of the pandemic. Here they forecast 9.4% default rates
- Optimistic Scenario: Here they forecast a 2.7% default rate.
Their base case scenario is not in line with the thinking of our own macro-economic experts and as such our scenario is closer in line with Moody's moderately pessimistic recession. Here they forecast a rise of European default rates up to 6.5% in the coming 12 months. This is of course slightly higher than our 4.5-5.0% forecast.
Author:Timothy Rahill, Jeroen van den Broek

Legal Disclaimer:
MENAFN provides the
information “as is” without warranty of any kind. We do not accept
any responsibility or liability for the accuracy, content, images,
videos, licenses, completeness, legality, or reliability of the information
contained in this article. If you have any complaints or copyright
issues related to this article, kindly contact the provider above.
Most popular stories
Market Research

More Story


Comments
No comment