


Stationary Lead-Acid (SLA) Battery Market - 58% Of Growth To Originate From APAC| Evolving Opportunities With Enersys & Exide Industries Ltd. | Technavio'
(MENAFN- PR Newswire)
Technavio has announced its latest market research report titled Stationary Lead-Acid (SLA) Battery Market by End-user and Geography - Forecast and Analysis 2022-2026
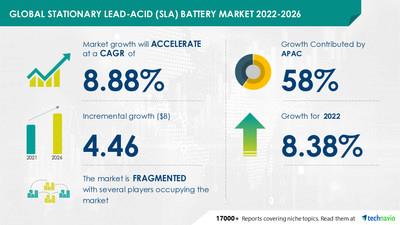
NEW YORK, May 2, 2022 /PRNewswire/ -- The global stationary lead-acid (SLA) Battery market size is expected to grow by USD4.46 billion from 2021 to 2026 at a CAGR of 8.88% as per Technavio. 58% of the market's growth will originate from APAC during the forecast period. China, India, and Japan are the key markets for stationary lead-acid (SLA) batteries in APAC. Market growth in this region will be faster than the growth of the market in other regions. The growing use of industrial lead-acid batteries in the renewable energy and industrial sectors will facilitate the stationary lead-acid (SLA) battery market growth in APAC over the forecast period.
Technavio has announced its latest market research report titled Stationary Lead-Acid (SLA) Battery Market by End-user and Geography - Forecast and Analysis 2022-2026
For more insights on the market share of various regions - Download the sample report in MINUTES
Read the 120-page report with TOC on 'Stationary Lead-Acid (SLA) Battery Market Analysis Report by End-user (Telecom, UPS, and Others) and Geography (APAC, Europe, North America, Middle East, and Africa, and South America), and the Segment Forecasts,2022-2026'. Gain competitive intelligence about market leaders. Track key industry opportunities, trends, and threats. Information on marketing, brand, strategy and market development, sales, and supply functions.
Stationary Lead-Acid (SLA) Battery: Drivers, Trends & Challenges
The stationary lead-acid (SLA) Battery market is driven by the increased investment in green telecom . In addition, the development of advanced lead-acid batteries is anticipated to boost the growth of the Stationary Lead-Acid (SLA) Battery Market. However, factors such as shortfalls of lead-acid batteries may impede the market growth. The holistic analysis of the drivers, trends & challenges will help in deducing end goals and refining marketing strategies to gain a competitive edge.
For additional information on market dynamics - Download a sample report now!
Some of the key Stationary Lead-Acid (SLA) Battery Players with offerings:
The stationary lead-acid (SLA) Battery market is fragmented and the vendors are deploying organic and inorganic growth strategies to compete in the market. The stationary lead-acid (SLA) battery market forecast report offers in-depth insights into key vendor profiles. The profiles include information on the production, sustainability, and prospects of the leading companies.
- hoppecke.com - The company offers stationary lead-acid batteries that have a special feature which is the pocketing of the negative plates this protects the active mass and effectively prevents short circuits, which ensures maximum reliability
- Amara Raja Batteries Ltd. - The company offers stationary lead-acid batteries to aftermarket and top original equipment manufacturers.
- C and D Technologies Inc. - The company offers stationary lead-acid batteries that are sealed and emit no gas during normal operation, they contain potentially explosive gases, which may be released under abnormal operating conditions.
- EnerSys - The company offers stationary lead-acid batteries that deliver long life, high energy density, and superior shelf life for a wide range of wireless and fixed-line communication applications.
- Exide Industries Ltd. - The company offers stationary lead-acid batteries that are designed for Home UPS to ensure the availability of uninterrupted and regulated power during mains failure or dip in input voltage.
- To know about the offerings of all major vendors - Download a sample report now!
Stationary Lead-Acid (SLA) Battery Market - Segmentation Analysis
End-user Outlook (Revenue, USD bn, 2021-2026)
- Telecom - size and forecast 2021-2026
- UPS - size and forecast 2021-2026
- Others - size and forecast 2021-2026
Geography Outlook (Revenue, USD bn, 2021-2026)
- APAC - size and forecast 2021-2026
- Europe - size and forecast 2021-2026
- North America - size and forecast 2021-2026
- Middle East and Africa - size and forecast 2021-2026
- South America - size and forecast 2021-2026
To know about the contribution of each segment - Grab an exclusive Report
Related Reports:
- The electricity trading market share is estimated to reach a value of USD 99.46 million from 2021 to 2026 at an accelerating CAGR of 6.3%. Download a sample now!
- The electric vehicle (EV) battery market share is estimated to reach a value of USD 38.05 billion from 2021 to 2026 at an accelerating CAGR of 14.87%. Download a sample now!
| Stationary Lead-Acid (SLA) Battery Market Scope | |
| Report Coverage | Details |
| Page number | 120 |
| Base year | 2021 |
| Forecast period | 2022-2026 |
| Growth momentum & CAGR | Accelerate at a CAGR of 8.88% |
| Market growth 2022-2026 | USD 4.46 billion |
| Market structure | Fragmented |
| YoY growth (%) | 8.38 |
| Performing market contribution | APAC at 58% |
| Competitive landscape | Leading companies, competitive strategies, consumer engagement scope |
| Companies profiled | Accumulatorenwerke HOPPECKE Carl Zoellner and Sohn GmbH, Amara Raja Batteries Ltd., C and D Technologies Inc., Clarios, Coslight International Group, Crown Micro, East Penn Manufacturing Co. Inc., EnerSys, Exide Industries Ltd., GS Yuasa Corp., Hankook and Co. Ltd., Hitachi Ltd., Leoch International Technology Ltd., MIDAC SpA, Zhejiang Narada Power Source Co. Ltd., Panasonic Corp., Rolls Battery, SEBANG GLOBAL BATTERY Co. Ltd., Shandong Sacred Sun Power Sources Co. Ltd., and Tianneng Battery |
| Market Dynamics | Parent market analysis, Market growth inducers and obstacles, Fast-growing and slow-growing segment analysis, COVID 19 impact and future consumer dynamics, market condition analysis for the forecast period, |
| Customization purview | If our report has not included the data that you are looking for, you can reach out to our analysts and get segments customized. |
Table of Content
1 Executive Summary
- 1.1 Market overview
- Exhibit 01: Executive Summary – Chart on Market Overview
- Exhibit 02: Executive Summary – Data Table on Market Overview
- Exhibit 03: Executive Summary – Chart on Global Market Characteristics
- Exhibit 04: Executive Summary – Chart on Market by Geography
- Exhibit 05: Executive Summary – Chart on Market Segmentation by End-user
- Exhibit 06: Executive Summary – Chart on Incremental Growth
- Exhibit 07: Executive Summary – Data Table on Incremental Growth
- Exhibit 08: Executive Summary – Chart on Vendor Market Positioning
2 Market Landscape
- 2.1 Market ecosystem
- Exhibit 09: Parent market
- Exhibit 10: Market Characteristics
3 Market Sizing
- 3.1 Market definition
- Exhibit 11: Offerings of vendors included in the market definition
- 3.2 Market segment analysis
- Exhibit 12: Market segments
- 3.3 Market size 2021
- 3.4 Market outlook: Forecast for 2021-2026
- Exhibit 13: Chart on Global - Market size and forecast 2021-2026 ($ million)
- Exhibit 14: Data Table on Global - Market size and forecast 2021-2026 ($ million)
- Exhibit 15: Chart on Global Market: Year-over-year growth 2021-2026 (%)
- Exhibit 16: Data Table on Global Market: Year-over-year growth 2021-2026 (%)
4 Five Forces Analysis
- 4.1 Five forces summary
- Exhibit 17: Five forces analysis - Comparison between2021 and 2026
- 4.2 Bargaining power of buyers
- Exhibit 18: Chart on Bargaining power of buyers – Impact of key factors 2021 and 2026
- 4.3 Bargaining power of suppliers
- Exhibit 19: Bargaining power of suppliers – Impact of key factors in 2021 and 2026
- 4.4 Threat of new entrants
- Exhibit 20: Threat of new entrants – Impact of key factors in 2021 and 2026
- 4.5 Threat of substitutes
- Exhibit 21: Threat of substitutes – Impact of key factors in 2021 and 2026
- 4.6 Threat of rivalry
- Exhibit 22: Threat of rivalry – Impact of key factors in 2021 and 2026
- 4.7 Market condition
- Exhibit 23: Chart on Market condition - Five forces 2021 and 2026
5 Market Segmentation by End-user
- 5.1 Market segments
- Exhibit 24: Chart on End-user - Market share 2021-2026 (%)
- Exhibit 25: Data Table on End-user - Market share 2021-2026 (%)
- 5.2 Comparison by End-user
- Exhibit 26: Chart on Comparison by End-user
- Exhibit 27: Data Table on Comparison by End-user
- 5.3 Telecom - Market size and forecast 2021-2026
- Exhibit 28: Chart on Telecom - Market size and forecast 2021-2026 ($ million)
- Exhibit 29: Data Table on Telecom - Market size and forecast 2021-2026 ($ million)
- Exhibit 30: Chart on Telecom - Year-over-year growth 2021-2026 (%)
- Exhibit 31: Data Table on Telecom - Year-over-year growth 2021-2026 (%)
- 5.4 UPS - Market size and forecast 2021-2026
- Exhibit 32: Chart on UPS - Market size and forecast 2021-2026 ($ million)
- Exhibit 33: Data Table on UPS - Market size and forecast 2021-2026 ($ million)
- Exhibit 34: Chart on UPS - Year-over-year growth 2021-2026 (%)
- Exhibit 35: Data Table on UPS - Year-over-year growth 2021-2026 (%)
- 5.5 Others - Market size and forecast 2021-2026
- Exhibit 36: Chart on Others - Market size and forecast 2021-2026 ($ million)
- Exhibit 37: Data Table on Others - Market size and forecast 2021-2026 ($ million)
- Exhibit 38: Chart on Others - Year-over-year growth 2021-2026 (%)
- Exhibit 39: Data Table on Others - Year-over-year growth 2021-2026 (%)
- 5.6 Market opportunity by End-user
- Exhibit 40: Market opportunity by End-user ($ million)
6 Customer Landscape
- 6.1 Customer landscape overview
- Exhibit 41: Analysis of price sensitivity, lifecycle, customer purchase basket, adoption rates, and purchase criteria
7 Geographic Landscape
- 7.1 Geographic segmentation
- Exhibit 42: Chart on Market share by geography 2021-2026 (%)
- Exhibit 43: Data Table on Market share by geography 2021-2026 (%)
- 7.2 Geographic comparison
- Exhibit 44: Chart on Geographic comparison
- Exhibit 45: Data Table on Geographic comparison
- 7.3 APAC - Market size and forecast 2021-2026
- Exhibit 46: Chart on APAC - Market size and forecast 2021-2026 ($ million)
- Exhibit 47: Data Table on APAC - Market size and forecast 2021-2026 ($ million)
- Exhibit 48: Chart on APAC - Year-over-year growth 2021-2026 (%)
- Exhibit 49: Data Table on APAC - Year-over-year growth 2021-2026 (%)
- 7.4 Europe - Market size and forecast 2021-2026
- Exhibit 50: Chart on Europe - Market size and forecast 2021-2026 ($ million)
- Exhibit 51: Data Table on Europe - Market size and forecast 2021-2026 ($ million)
- Exhibit 52: Chart on Europe - Year-over-year growth 2021-2026 (%)
- Exhibit 53: Data Table on Europe - Year-over-year growth 2021-2026 (%)
- 7.5 North America - Market size and forecast 2021-2026
- Exhibit 54: Chart on North America - Market size and forecast 2021-2026 ($ million)
- Exhibit 55: Data Table on North America - Market size and forecast 2021-2026 ($ million)
- Exhibit 56: Chart on North America - Year-over-year growth 2021-2026 (%)
- Exhibit 57: Data Table on North America - Year-over-year growth 2021-2026 (%)
- 7.6 Middle East and Africa - Market size and forecast 2021-2026
- Exhibit 58: Chart on Middle East and Africa - Market size and forecast 2021-2026 ($ million)
- Exhibit 59: Data Table on Middle East and Africa - Market size and forecast 2021-2026 ($ million)
- Exhibit 60: Chart on Middle East and Africa - Year-over-year growth 2021-2026 (%)
- Exhibit 61: Data Table on Middle East and Africa - Year-over-year growth 2021-2026 (%)
- 7.7 South America - Market size and forecast 2021-2026
- Exhibit 62: Chart on South America - Market size and forecast 2021-2026 ($ million)
- Exhibit 63: Data Table on South America - Market size and forecast 2021-2026 ($ million)
- Exhibit 64: Chart on South America - Year-over-year growth 2021-2026 (%)
- Exhibit 65: Data Table on South America - Year-over-year growth 2021-2026 (%)
- 7.8 China - Market size and forecast 2021-2026
- Exhibit 66: Chart on China - Market size and forecast 2021-2026 ($ million)
- Exhibit 67: Data Table on China - Market size and forecast 2021-2026 ($ million)
- Exhibit 68: Chart on China - Year-over-year growth 2021-2026 (%)
- Exhibit 69: Data Table on China - Year-over-year growth 2021-2026 (%)
- 7.9 US - Market size and forecast 2021-2026
- Exhibit 70: Chart on US - Market size and forecast 2021-2026 ($ million)
- Exhibit 71: Data Table on US - Market size and forecast 2021-2026 ($ million)
- Exhibit 72: Chart on US - Year-over-year growth 2021-2026 (%)
- Exhibit 73: Data Table on US - Year-over-year growth 2021-2026 (%)
- 7.10 India - Market size and forecast 2021-2026
- Exhibit 74: Chart on India - Market size and forecast 2021-2026 ($ million)
- Exhibit 75: Data Table on India - Market size and forecast 2021-2026 ($ million)
- Exhibit 76: Chart on India - Year-over-year growth 2021-2026 (%)
- Exhibit 77: Data Table on India - Year-over-year growth 2021-2026 (%)
- 7.11 Japan - Market size and forecast 2021-2026
- Exhibit 78: Chart on Japan - Market size and forecast 2021-2026 ($ million)
- Exhibit 79: Data Table on Japan - Market size and forecast 2021-2026 ($ million)
- Exhibit 80: Chart on Japan - Year-over-year growth 2021-2026 (%)
- Exhibit 81: Data Table on Japan - Year-over-year growth 2021-2026 (%)
- 7.12 Germany - Market size and forecast 2021-2026
- Exhibit 82: Chart on Germany - Market size and forecast 2021-2026 ($ million)
- Exhibit 83: Data Table on Germany - Market size and forecast 2021-2026 ($ million)
- Exhibit 84: Chart on Germany - Year-over-year growth 2021-2026 (%)
- Exhibit 85: Data Table on Germany - Year-over-year growth 2021-2026 (%)
- 7.13 Market opportunity by geography
- Exhibit 86: Market opportunity by geography ($ million)
8 Drivers, Challenges, and Trends
- 8.1 Market drivers
- 8.2 Market challenges
- 8.3 Impact of drivers and challenges
- Exhibit 87: Impact of drivers and challenges in 2021 and 2026
- 8.4 Market trends
9 Vendor Landscape
- 9.1 Overview
- 9.2 Vendor landscape
- Exhibit 88: Overview on Criticality of inputs and Factors of differentiation
- 9.3 Landscape disruption
- Exhibit 89: Overview on factors of disruption
- 9.4 Industry risks
- Exhibit 90: Impact of key risks on business
10 Vendor Analysis
- 10.1 Vendors covered
- Exhibit 91: Vendors covered
- 10.2 Market positioning of vendors
- Exhibit 92: Matrix on vendor position and classification
- 10.3 Accumulatorenwerke HOPPECKE Carl Zoellner and Sohn GmbH
- Exhibit 93: Accumulatorenwerke HOPPECKE Carl Zoellner and Sohn GmbH - Overview
- Exhibit 94: Accumulatorenwerke HOPPECKE Carl Zoellner and Sohn GmbH - Product / Service
- Exhibit 95: Accumulatorenwerke HOPPECKE Carl Zoellner and Sohn GmbH - Key offerings
- 10.4 Amara Raja Batteries Ltd.
- Exhibit 96: Amara Raja Batteries Ltd. - Overview
- Exhibit 97: Amara Raja Batteries Ltd. - Business segments
- Exhibit 98: Amara Raja Batteries Ltd. - Key news
- Exhibit 99: Amara Raja Batteries Ltd. - Key offerings
- Exhibit 100: Amara Raja Batteries Ltd. - Segment focus
- 10.5 C and D Technologies Inc.
- Exhibit 101: C and D Technologies Inc. - Overview
- Exhibit 102: C and D Technologies Inc. - Product / Service
- Exhibit 103: C and D Technologies Inc. - Key offerings
- 10.6 Clarios
- Exhibit 104: Clarios - Overview
- Exhibit 105: Clarios - Product / Service
- Exhibit 106: Clarios - Key offerings
- 10.7 Coslight International Group
- Exhibit 107: Coslight International Group - Overview
- Exhibit 108: Coslight International Group - Product / Service
- Exhibit 109: Coslight International Group - Key offerings
- 10.8 Crown Micro
- Exhibit 110: Crown Micro - Overview
- Exhibit 111: Crown Micro - Product / Service
- Exhibit 112: Crown Micro - Key offerings
- 10.9 East Penn Manufacturing Co. Inc.
- Exhibit 113: East Penn Manufacturing Co. Inc. - Overview
- Exhibit 114: East Penn Manufacturing Co. Inc. - Product / Service
- Exhibit 115: East Penn Manufacturing Co. Inc. - Key news
- Exhibit 116: East Penn Manufacturing Co. Inc. - Key offerings
- 10.10 EnerSys
- Exhibit 117: EnerSys - Overview
- Exhibit 118: EnerSys - Business segments
- Exhibit 119: EnerSys - Key news
- Exhibit 120: EnerSys - Key offerings
- Exhibit 121: EnerSys - Segment focus
- 10.11 Exide Industries Ltd.
- Exhibit 122: Exide Industries Ltd. - Overview
- Exhibit 123: Exide Industries Ltd. - Business segments
- Exhibit 124: Exide Industries Ltd. - Key offerings
- Exhibit 125: Exide Industries Ltd. - Segment focus
- 10.12 GS Yuasa Corp.
- Exhibit 126: GS Yuasa Corp. - Overview
- Exhibit 127: GS Yuasa Corp. - Business segments
- Exhibit 128: GS Yuasa Corp. - Key news
- Exhibit 129: GS Yuasa Corp. - Key offerings
- Exhibit 130: GS Yuasa Corp. - Segment focus
11 Appendix
- 11.1 Scope of the report
- 11.2 Inclusions and exclusions checklist
- Exhibit 131: Inclusions checklist
- Exhibit 132: Exclusions checklist
- 11.3 Currency conversion rates for US$
- Exhibit 133: Currency conversion rates for US$
- 11.4 Research methodology
- Exhibit 134: Research methodology
- Exhibit 135: Validation techniques employed for market sizing
- Exhibit 136: Information sources
- 11.5 List of abbreviations
- Exhibit 137: List of abbreviations
About Technavio
Technavio is a leading global technology research and advisory company. Their research and analysis focuses on emerging market trends and provides actionable insights to help businesses identify market opportunities and develop effective strategies to optimize their market positions.
With over 500 specialized analysts, Technavio's report library consists of more than 17,000 reports and counting, covering 800 technologies, spanning across 50 countries. Their client base consists of enterprises of all sizes, including more than 100 Fortune 500 companies. This growing client base relies on Technavio's comprehensive coverage, extensive research, and actionable market insights to identify opportunities in existing and potential markets and assess their competitive positions within changing market scenarios.
Contacts
Technavio ResearchJesse MaidaMedia & Marketing ExecutiveUS: +1 844 364 1100UK: +44 203 893 3200Email: [email protected] Website:
SOURCE Technavio

Legal Disclaimer:
MENAFN provides the
information “as is” without warranty of any kind. We do not accept
any responsibility or liability for the accuracy, content, images,
videos, licenses, completeness, legality, or reliability of the information
contained in this article. If you have any complaints or copyright
issues related to this article, kindly contact the provider above.
Most popular stories
Market Research

- Wiener Bank SE Partners With REAL Finance To Revolutionize Asset Management With Blockchain Technology
- B2PRIME Secures DFSA Licence To Operate From The DIFC, Setting A New Institutional Benchmark For MENA & Gulf Region
- Stonehaven Circle Marks 13Th Anniversary With Hadrian Colwyn Leading Calvio Ailegacyx Innovation
- Daytrading Publishes New Study On The Dangers Of AI Tools Used By Traders
- T-REX Launches Intelligence Layer To Fix Web3's Value Distribution Problem
- Bitget Launches PTBUSDT For Futures Trading And Bot Integration
More Story


Comments
No comment