


403
Sorry!!
Error! We're sorry, but the page you were looking for doesn't exist.
, Litecoin (LTC), Ethereum (ETH) Analysis: Is Momentum Fading?")
Bitcoin (BTC), Litecoin (LTC), Ethereum (ETH) Analysis: Is Momentum Fading?
(MENAFN- DailyFX)
Bitcoin (BTC/USD), Litecoin (LTC/USD), Ethereum (ETH/USD), Technical Analysis Talking Points

Bitcoin Technical Outlook


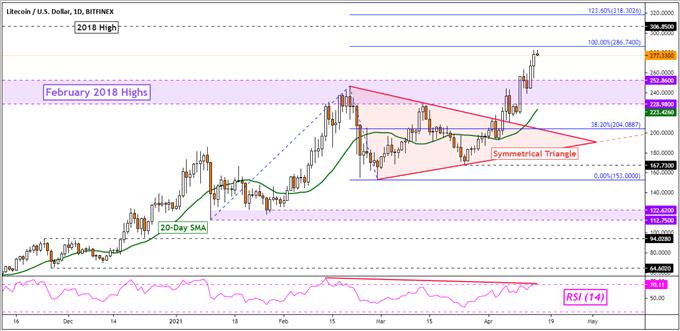
LTC/USD- Daily Chart
- Bitcoin looking vulnerable as push into new highs struggles
- Litecoin extended gains above triangle, momentum is fading
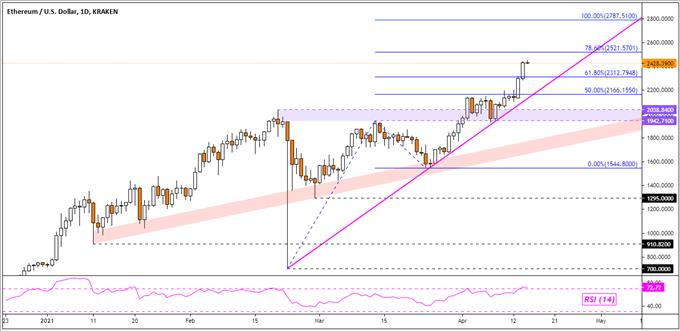
- Ethereum 's push into record highs appears more solidified
Bitcoin Technical Outlook
Bitcoin struggled to maintain a push into new all-time highs over the past 24 hours as Coinbase fell 23% from its intraday peak after a volatile initial public offering . BTC/USD left behind a neutral Doji candlestick . When a Doji occurs at or around a new high, it signals indecision and can at times precede a turn lower. A further downside close could open the door to further losses.
Negative RSI divergence does highlight that upside momentum is fading, which may hint at a turning point. Still, that would place the focus on rising support from January, which could reinstate the dominant upside focus. If it doesn't, then the 100-day Simple Moving Average could down the road. Otherwise, taking out the midpoint of the Fibonacci extension at 66833 exposes the 61.8% level at 70733.
BTC/USD - Daily ChartChart Created in TradingView
Litecoin Technical OutlookLitecoin extended gains to new highs after breaking above a Symmetrical Triangle, which I noted the formation of earlier this month . LTC/USD also took out highs from February 2018, opening the door to revisiting the peak from the same year at 306.85. However, getting there entails a push above the 100% Fibonacci extension at 286.74.
Negative RSI divergence does show that upside momentum is fading however, which can at times precede a turn lower. That could place the focus on the 20-day SMA which can maintain the dominant upside focus. The 228 252 inflection zone could also come into play in the event of a turn lower. Otherwise, extending beyond peaks from 2018 exposes the 123.6% extension at 318.3026.
LTC/USD- Daily Chart
Chart Created in TradingView
Ethereum Technical OutlookEthereum also extended gains into fresh all-time highs over the past 24 hours. This followed a push above the former 1942 2038 resistance zone. ETH/USD closed above the 61.8% Fibonacci extension at 2312.7948, exposing the 78.6% level at 252.5701. Maintaining the focus to the upside in the near term appears to be rising support from the February low pink line on the daily chart below.
If the 78.6% level holds, a turn lower towards rising support may occur. Closing under the trendline would then expose a zone of rising support from January that has a more gradual slope. The outlook could shift further bearish if Ethereum manages to get under this trendline. Otherwise, extending gains places the focus on the 100% level at 2787.51.
ETH/USD - Daily ChartChart Created in TradingView
--- Written by Daniel Dubrovsky, Strategist for DailyFX.com
To contact Daniel, use the comments section below or @ddubrovskyFX on Twitter

Legal Disclaimer:
MENAFN provides the
information “as is” without warranty of any kind. We do not accept
any responsibility or liability for the accuracy, content, images,
videos, licenses, completeness, legality, or reliability of the information
contained in this article. If you have any complaints or copyright
issues related to this article, kindly contact the provider above.
Most popular stories
Market Research

More Story


Comments
No comment