


403
Sorry!!
Error! We're sorry, but the page you were looking for doesn't exist.

Trading the Bullish Engulfing Candle
(MENAFN- DailyFX) Bullish Engulfing Candlestick Pattern: Main Talking Points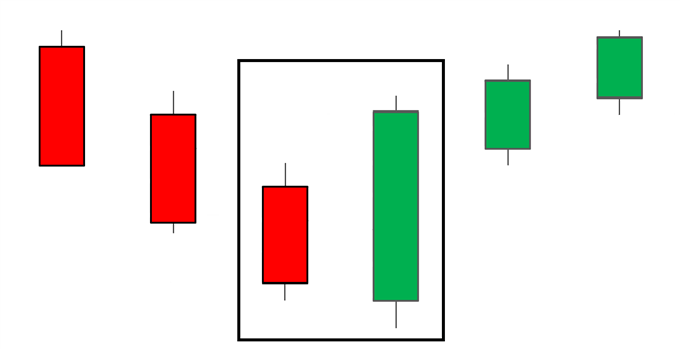
 How to spot a bullish engulfing pattern and what does it mean?
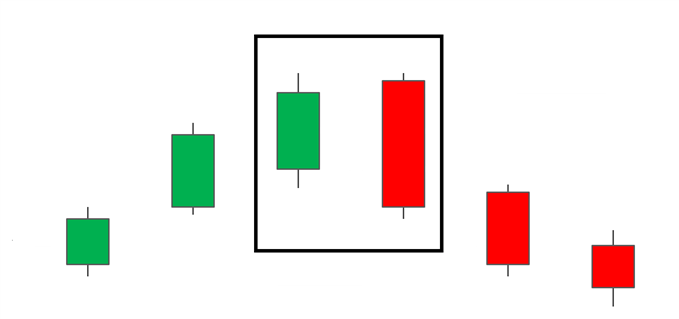
 Further Reading on Candlestick PatternsThe bullish engulfing pattern is just one of many candlestick patterns traders should know. Boost your trading knowledge by learning theTop 10 candlestick patterns . To go back to basics, check out our easy guide onHow to Read Candlestick Charts . At DailyFX we run a number of webinars that cover candle formations and price action in general. For a full list of our webinars take a look at ourwebinar calendar . If you are just starting out on your forex trading journey it is essential to understand the basics of forex trading in ourNew to Forexguide.
The bullish engulfing candle is one of the forex market's most clear-cut price action signals. Many traders will use this candlestick pattern to identify price reversals and continuations to support their trading strategies.
This article will cover:
What is the bullish engulfing pattern? How to identify and interpret the bullish engulfing candle in forex trading Best approaches for trading forex and NYSE stocks with the bullish engulfing candle What is a bullish engulfing candle?The bullish engulfing candle appears at the bottom of a downtrend and indicates a surge in buying pressure. The bullish engulfing pattern often triggers a reversal intrendas more buyers enter the market to drive prices up further. The pattern involves two candles with the second candle completely engulfing the body of the previous red candle.
The image below depicts the bullish engulfing pattern appearing at the bottom of a downtrend.
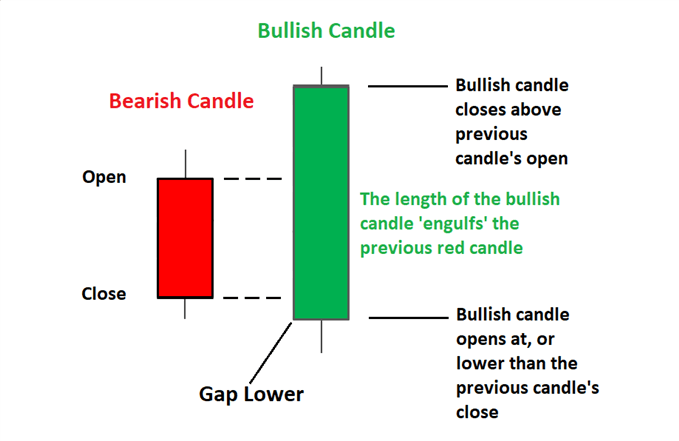
The following image focuses on the bearish and bullish candles that constitute the bullish engulfing pattern.
How to spot a bullish engulfing pattern and what does it mean?Characteristics of a bullish engulfing pattern:
Strong green candle that 'engulfs' the prior red candle body (disregard the wicks) Occurs at the bottom of a downward trend Stronger signals are provided when the red candle is adoji , or when subsequent candles close above the high of the bullish candle.What does it tell traders?
Trend reversal to the upside (bullish reversal) Selling pressure losing momentum at this key level.Advantages of trading with the bullish engulfing candle:
Easy to identify Attractive entry levels can be obtained after receiving confirmation of the bullish reversal. Know the difference between a bullish and a bearish engulfing patternEngulfing patterns can be bullish and bearish. Thebearish engulfing patternis essentially the opposite of the bullish engulfing pattern discussed above. Instead of appearing in a downtrend, it appears at the top of an uptrend and presents traders with a signal to goshort . It is characterized by a green candle being engulfed by a larger red candle.
Bearish Engulfing Pattern
Below is a summary of the main differences between the bullish and bearish engulfing patterns. Traders should keep these in mind in order to avoid false signals.
Engulfing Pattern | Characteristics | Location | Signal |
Bullish Engulfing | Green candle engulfs previous (smaller) red candle | Appears at the bottom of a downtrend | Bullish signal (Bullish reversal) |
Bearish Engulfing | Red candle engulfs previous (smaller) green candle | Appears at the top of an uptrend | Bearish signal (Bearish reversal) |
Find out more by reading our comprehensive guide onengulfing candlesticks .
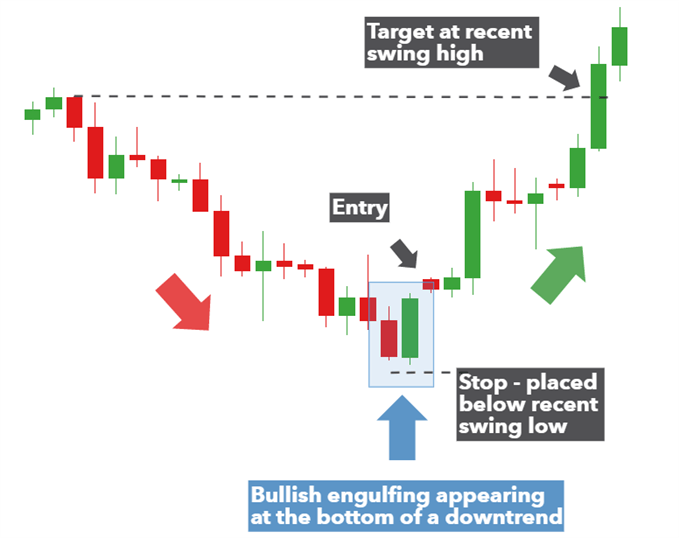
Using a Bullish Engulfing Candlestick Pattern in TradingBullish engulfing and forex trading
The bullish engulfing candle pattern can be observed in action in theGBP/USDdaily chart presented below. Here, the pattern is shown in a downtrend. Subsequent candles validated the signal as they closed above the high of the bullish candle.Stopscan be set below the low of the bullish engulfing pattern with a target set at a key level that price has bounced off previously – this is the recent swing high and provides a positiverisk to reward ratio .
Bullish engulfing and stock trading
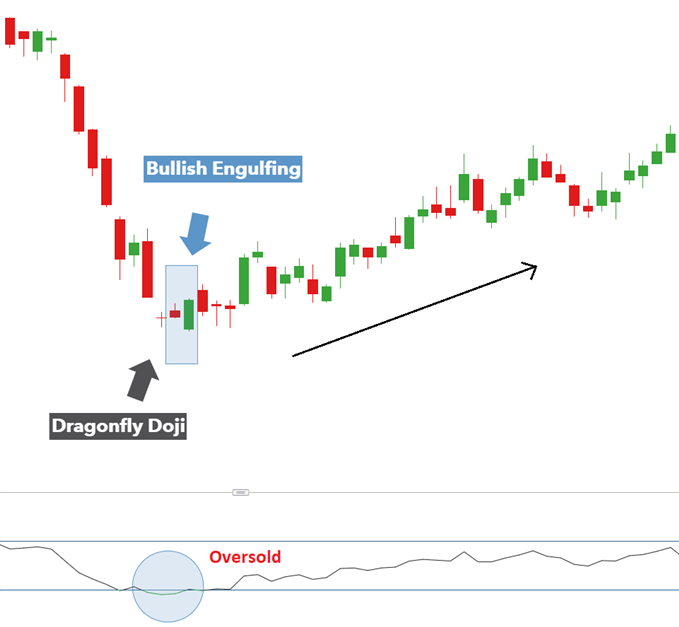
Not only is the Bullish engulfing a popular strategy in forex but it can also be applied to the stock market. A bullish engulfing trading strategy is provided below on Fedex Corp [FDE], listed on the NYSE
The key tobuilding confidence when tradingthe bullish engulfing candle is to complement the candle formation with a supporting signal/ indicator .
The chart below shows the presence of aDragonfly DojiJust before the engulfing pattern - signaling the rejection of lower prices. This fits the bullish bias along with the oversold signal on the RSI at the bottom of the chart. These supporting signals provide tock traders with greater conviction before executing the trade.
Thestoploss can be placed below the recent swing low - which is the low of the Dragonfly Doji. The target (limit) can be placed at a key level that price has bounced off previously, provided it results in a positiverisk to reward ratio .
Further Reading on Candlestick PatternsThe bullish engulfing pattern is just one of many candlestick patterns traders should know. Boost your trading knowledge by learning theTop 10 candlestick patterns . To go back to basics, check out our easy guide onHow to Read Candlestick Charts . At DailyFX we run a number of webinars that cover candle formations and price action in general. For a full list of our webinars take a look at ourwebinar calendar . If you are just starting out on your forex trading journey it is essential to understand the basics of forex trading in ourNew to Forexguide. 
Legal Disclaimer:
MENAFN provides the
information “as is” without warranty of any kind. We do not accept
any responsibility or liability for the accuracy, content, images,
videos, licenses, completeness, legality, or reliability of the information
contained in this article. If you have any complaints or copyright
issues related to this article, kindly contact the provider above.
Most popular stories
Market Research

More Story


Comments
No comment