


403
Sorry!!
Error! We're sorry, but the page you were looking for doesn't exist.

Euro Currency Volatility Sets Draghi, ZEW Survey in Crosshairs
(MENAFN- DailyFX) EURO CURRENCY VOLATILITY – TALKING POINTSEuro currency volatility could creep higher with risks surrounding ECB's Draghi and the ZEW survey of economic expectations EURUSDprice action will be flooded with noise this week owing to Wednesday'sFOMCrate decision EURAUDeyes multi-year highs whileEURCADlooks to break out from its tight trading range Find out how toBuild Confidence in Tradingand bring your skills as a trader to the next level 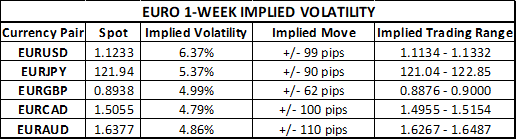
ECB President Mario Draghi takes to the spotlight with a series of speeches this week. As such, 1-week implied volatility readings on the majorEURcurrency pairs have unsurprisingly risen seeing that remarks from the head of the world's largestcentral bankrisks stirring price action in the Euro. Euro implied volatility may appear relatively low, however, which could be explained by the possibility that markets are beginning to discount commentary from the current ECB President and are instead placing more weight on remarks frompotential Draghi successors.Yet, expected EUR price action threatens to climb higher if markets get a jolt from Tuesday'sZEW Surveyof Expectations.
CURRENCY VOLATILITY – EURUSD, EURJPY, EURGBP, EURCAD, EURADWith the JuneFed meetinglargely dictating EURUSD price action throughout the week, less conventional Euro currency crosses likeEURJPY ,EURGBP , EURCAD and EURAUD may offer unique opportunities over the short-term. Particularly interesting is spot EURAUD which is on the brink closing at its highest level since 2009 while spot EURCAD looks set to take off from its tightly-wound coil.
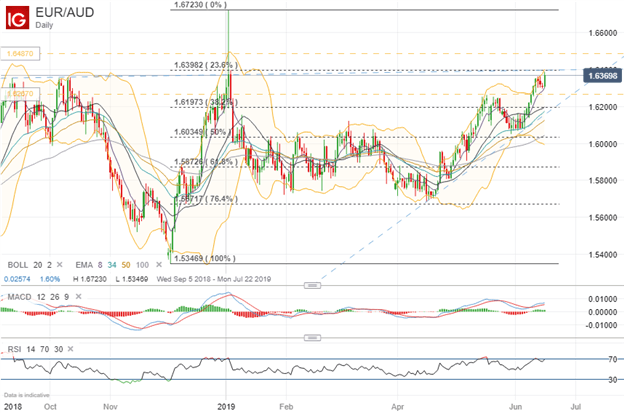
EURAUD PRICE CHART: DAILY TIME FRAME (SEPTEMBER 05, 2018 TO JUNE 17, 2019) Spot EURAUD is attempting to eclipse firm resistance from the 1.6400 price level once again. This currency pair could also see a sizable response to the release of June'sRBA meetingminutes slated for Tuesday at 1:30 GMT. If EURAUD can top the 23.6% Fibonacci retracement drawn from the low printed December 2018 and January 2019 flash crash high, bulls could quickly target the upper bound of the 1-standard deviation trading range derived from the 1-week implied volatility of 4.86%. On the contrary, if EURAUD fails to continue its ascent, traders could push spot prices towards support near the 1-week implied low near 1.6250 which served as an area of resistance last month.
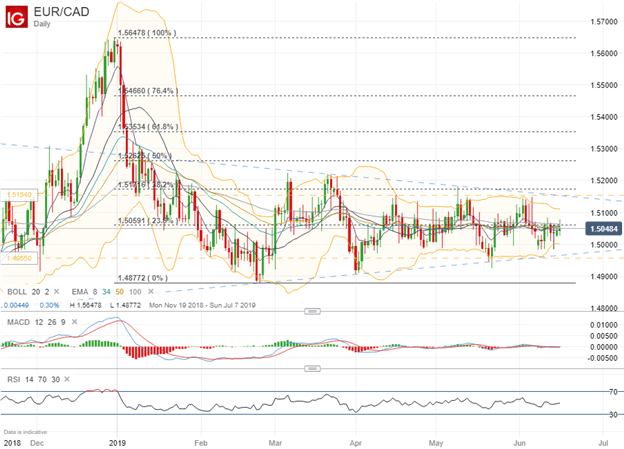
EURCAD PRICE CHART: DAILY TIME FRAME (NOVEMBER 18, 2018 TO JUNE 17, 2019) EURCAD has traded in a tight range throughout most of the year with the currency pair looking for a catalyst to spark its next move. A move to the upside could be driven by the relatively firm stance revealed at the latestECB meetingcoupling withcrude oilprices sinking into another bear market. If spot EURCAD can overcome resistance posed by the 23.6% Fibonacci retracement of its year-to-date high and low, the 1.5150 price level could be eyed as a possible upside target.
This area closely aligns with the 1-week implied high calculated from an implied volatility reading of 4.79%. Looking to the downside, the 1.5 handle could serve as a psychologically-important level of support as spot EURCAD continues to form its series of higher lows. Below this price level, the 1-week implied low of 1.4955 and rising bullish trendline could provide EURCAD with a degree of buoyance.
- Written byRich Dvorak , Junior Analyst for DailyFX
- Follow@RichDvorakFXon Twitter

Legal Disclaimer:
MENAFN provides the
information “as is” without warranty of any kind. We do not accept
any responsibility or liability for the accuracy, content, images,
videos, licenses, completeness, legality, or reliability of the information
contained in this article. If you have any complaints or copyright
issues related to this article, kindly contact the provider above.
Most popular stories
Market Research

More Story


Comments
No comment