


403
Sorry!!
Error! We're sorry, but the page you were looking for doesn't exist.

Crude Oil Price May Be Carving Out a Top
(MENAFN- DailyFX) Crude Oil Price Highlights:WTIcrude oiltrading at 2016 t-line, lower-high could be near Brent oil trading at underside of multi-month channel Short-term price structures to pay attention to To see what fundamental drivers are expected to drive oil through the remainder of the quarter, check out theQ2 Crude Oil Forecast.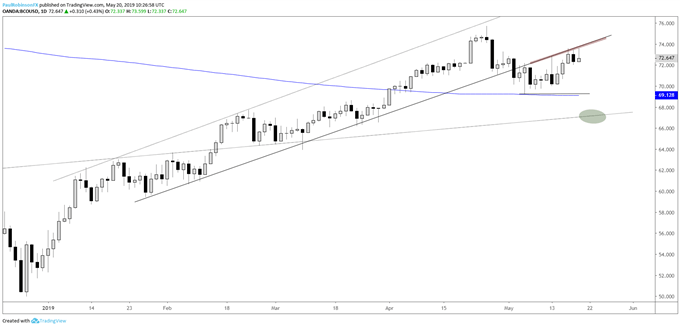 Brent Crude Oil 4-hr Chart (corrective-looking wedge)
 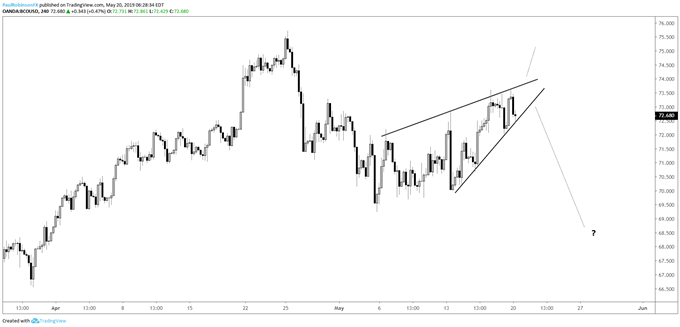 Forex & CFD Trader Resources Whether you are a new or experienced trader, we have several resources available to help you; indicator for trackingtrader sentiment , quarterlytrading forecasts , analytical and educationalwebinarsheld daily,trading guidesto help you improve trading performance, and one specifically for those who arenew to forex .
WTI crude oil trading at 2016 t-line, lower-high could be near The WTI crude oil contract is getting a lift off confluent support after looking like it might have been dead in the water. This has kept the upside in play, but a broader bullish outlook could quickly come back under fire if we see a meaningful turn lower from around current levels.
The Feb 2016 trend-line is just above the overnight high. A turn down from there will immediately have support in focus, but even as such price action will certainly increase the probability that recent strength will result in a lower-high relative to the peak carved out in April.To validate this scenario the channel line from January will need to be broken along with the 200-day and the powerful reversal-day low on May 6 at 59.98. Looking a little deeper, on the hourly chart a channel is developing with a clear set of boundaries thus far.
This pattern, with a little more time, developing between resistance and support could offer traders even greater clarity as to how to play oil. A breakout of a well-defined range could offer a decisive trading bias, with the downside likely holding more power given the strong level of support that will have to be breached in order to get oil rolling downhill.WTI Crude Oil Price Chart (underside of 2016 t-line)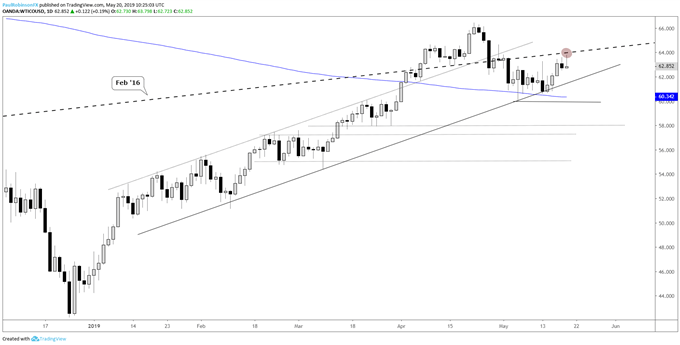 WTI Crude Oil Hourly Chart (channel forming)
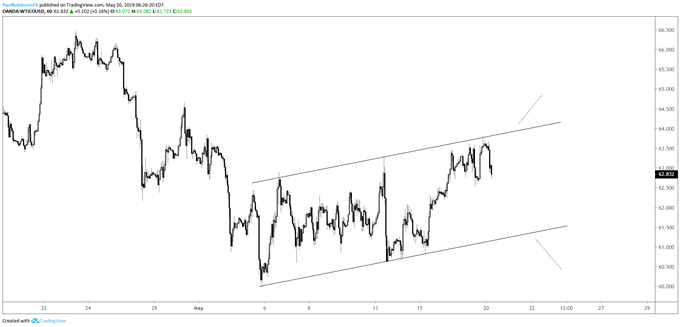 Brent contract may be more vulnerable should weakness set in The Brent contract is postured a little bit differently with its notable resistance level arriving at the underside of the same channel that WTI is still using as support. It has seen one powerful rejection of this line, occurring last Monday.
A solid downside break of the pattern will quickly have pressure brought on the 69.23 low from May 6 and the 200-day that lies only about 10 cents beyond there. A break of both of these thresholds should usher in another round of selling. No downside break, then look for neutral to higher prices, but from where I sit it won't hold as much appeal for a long.
Brent Crude Oil Daily Chart (underside of January-May channel) Brent Crude Oil 4-hr Chart (corrective-looking wedge) Forex & CFD Trader Resources Whether you are a new or experienced trader, we have several resources available to help you; indicator for trackingtrader sentiment , quarterlytrading forecasts , analytical and educationalwebinarsheld daily,trading guidesto help you improve trading performance, and one specifically for those who arenew to forex . ---Written by Paul Robinson, Market Analyst
You can follow Paul on Twitter at@PaulRobinsonFX
Legal Disclaimer:
MENAFN provides the
information “as is” without warranty of any kind. We do not accept
any responsibility or liability for the accuracy, content, images,
videos, licenses, completeness, legality, or reliability of the information
contained in this article. If you have any complaints or copyright
issues related to this article, kindly contact the provider above.
Most popular stories
Market Research

More Story


Comments
No comment