


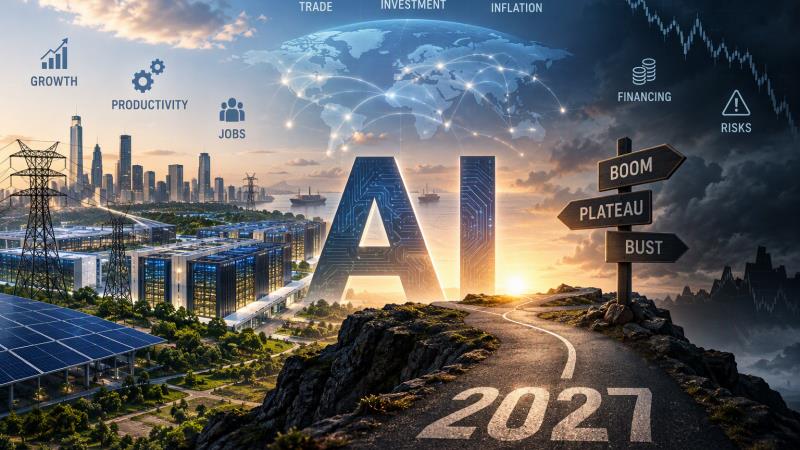
AI In 2027: 20 Questions For The Global Economy


The AI boom still has room to run. Investment is likely to continue rising in 2027, supported by strong demand and constrained supply. But its contribution to US growth is probably close to its peak as the sheer scale of investment makes further acceleration harder.
The boom is entering a new phase. The story is expanding beyond chips and data centres into power generation, grids and cooling. At the same time, financing is shifting gradually from hyperscalers' enormous cash flows towards debt, private credit and more complex structures, increasing the risks if expected returns fail to materialise.
The economic effects are becoming broader and more complicated. AI is supporting US growth and global technology supply chains, but may also be diverting investment from other parts of the economy. It is adding to inflationary pressures today through demand for energy, equipment and skilled labour, while the hoped-for productivity and disinflation benefits are likely to take longer to emerge.
The winners will not necessarily be those building the most AI infrastructure. Europe and Asia are benefiting from critical positions in the supply chain, while ultimately the largest gains may go to companies and economies that use AI most effectively.
Our base case is a plateau, not a bust. Today's leading technology companies are highly profitable and much less leveraged than their dotcom predecessors. But expectations are exceptionally high. The crucial question for 2027 is whether AI revenues and productivity gains begin to justify the extraordinary investment. If they do not, overcapacity, tighter financing and falling valuations could turn a plateau into a much harder landing.
Bigger than the dotcom boom, more important for growth and, so far, more safely financed.
Investment in US data centre structures, computers and software reached 5.6% of GDP in the second quarter of 2026, up from 3.8% in 2022, or 5.2% once imported hardware is netted out. That already puts the current boom above the dotcom peak in 2000, when business investment in computers, communications equipment and software reached about 4.5% of GDP, although still below Britain's railway mania of the 1840s, when railway investment alone reached roughly 6-7% of GDP.
So while this is not the biggest investment boom in history, it is already bigger than the last great technology boom. And it is having a much bigger economic impact: IT investment accounted for 16-18% of US GDP growth in 1998-2000; AI-related investment now accounts for 37%.
The biggest difference though is how this boom is being financed. Railways and telecom networks were built on debt and ended in defaults, largely through unrated railroad bonds in the 19th century and high-yield telecom debt after 2000. This time, investment has so far been funded mainly from the cash flows of some of the world's most profitable companies, with debt and equity only now being added at the margin.
The assets are different, too. Rails and fibre lasted for decades. Data centre shells, grids and power plants will also have long lives, but GPUs may have an economic life of just three to six years. That much shorter shelf life is central to the debate over whether today's investment will generate sufficient returns.
Still, the payoff could come faster. Factories took decades to redesign their floors around the electric motor. AI coding tools are paying off within months, and adoption is already disrupting software, accounting, online retail and advertising.
The common thread is that transformative technology does not necessarily mean good returns for those who finance the transformation. The Nasdaq lost almost 80% between 2000 and 2002, yet the fibre laid during the boom went on to underpin the streaming economy. Investors build the road; others get to drive on it.
How much more will be invested in AI in 2027, and is the boom still accelerating?Still accelerating in dollars, but probably peaking in its contribution to growth.
Momentum remains strong. Taiwan's leading semiconductor companies report order books that are full on a rolling 18-month basis, with any new capacity snapped up as soon as it comes online. Industry forecasts point to tight supply-demand conditions until 2028. Barring a wave of order cancellations or defaults, that points to another year of heavy AI investment in 2027, with hyperscaler capex expected to exceed US$1 trillion, increasingly geared towards AI infrastructure.
So is the boom peaking? In dollar terms, no. The constraint today is not appetite but supply: chips, power, permits and skilled electricians. When the bottleneck is the factory gate rather than the order book, spending is more likely to be stretched out than cut back.
But economists should be careful what they wish for. GDP growth responds to the change in investment, not its level. Investment that rises 50% a year adds a lot to growth; investment that rises 10% from a much bigger base adds far less; and investment that merely holds steady at a record high adds nothing at all. As the base gets bigger, the arithmetic gets tougher. That is why we expect AI investment to keep rising in 2027 while its contribution to US growth should peak.
What would signal a genuine top? Shortening lead times for chips and equipment, cancelled or postponed data centre projects, capex guidance that stops being revised up, and a widening gap between investment and AI revenues.
For now, the bigger risk is not that the money runs out in 2027, but that it keeps flowing so fast that the questions about returns grow much louder in 2028.
Chips and data centres are only the first layer. How big is the second wave of investment in grids, power generation and cooling?Bigger, slower and longer-lived than the first wave – and potentially more important for the macro outlook.
As a rule of thumb, US$1bn buys roughly 25MW of fully equipped AI compute capacity. Not all of the c.US$1 trillion of hyperscaler capex expected in 2027 will go to AI compute; some will fund conventional cloud infrastructure. But even if only half does, that implies more than 12GW of additional power demand – roughly the output of a dozen large nuclear reactors, needed around the clock.
That is where the second wave comes in: transmission lines, substations and transformers, gas turbines and renewables, battery storage and industrial cooling. In the US, grid connection queues and transformer lead times have already become binding constraints, and some developers are building their own generation on site rather than waiting for the grid.
This second wave differs from the first in three ways. First, the assets last for decades rather than years. A GPU may be obsolete by 2030; a substation built today will still be humming in 2060. That makes grid investment less vulnerable to a sudden AI downturn and more like the railway build-out of the 19th century. Second, it is slower. Permitting, planning and construction take years, which spreads the investment impulse over time and could stretch out the cycle. Third, it is more widely shared: grid and power equipment draws on suppliers in Europe and Asia as well as US construction and engineering firms, so the benefits travel further.
There is a catch. Somebody has to pay for the grid, and in regulated markets that somebody is often the household electricity customer. Rising power bills are already turning data centres into a political issue in parts of the US, and they feed straight into the inflation debate.
Chips are the sprint. Power is the marathon – and the marathon may end up mattering more.
Is this an American party, or does Europe get an invitation? Who supplies the picks and shovels?So far it is very much an American party – but Europe supplies the catering, and may turn out to be the smarter guest.
The investment gap is stark. US imports of computer equipment and semiconductors, a rough proxy for AI investment, have risen by about 258% since 2019, compared with 38% in the UK. Europe's own build-out is held back by high energy prices, scarce grid capacity – think of the data centre moratoria in Dublin and Amsterdam – and fragmented capital markets. The EU's AI gigafactories initiative is an attempt to catch up.
But Europe sells crucial picks and shovels. ASML expects €44-45bn of sales in 2026 and says customers keep raising their equipment-demand forecasts because of the scale and duration of AI investment. Infineon expects its AI-related revenues to rise from around €1.5bn in FY2026 to €2.5bn in FY2027. Add electrical and grid equipment, cables, power generation and cooling, and Europe's industrial base is well plugged into the American build-out.
Asia has been one of the biggest beneficiaries of the AI boom. The gains extend well beyond Korea and China, which have benefited from surging demand for memory chips and advanced technology hardware. Across ASEAN, economies have also attracted significant FDI into semiconductors, electronics manufacturing, and supporting supply chains as firms expand capacity and diversify production networks.
More importantly, the broad economic gains from AI come from using it, not building it – and here Europe is surprisingly good. Uptake is strong, and European SMEs use AI almost as intensively as large corporates, because the upfront investment is low. Nor does AI look like a winner-takes-all technology: switching costs are low and network effects limited. If model providers end up competing on price, the spoils go to the users – and Europe does not need to build nearly as many data centres to compete. Late to the construction site, Europe could still be early to move in.
There is a silver lining, too. Europe is far less exposed if the boom turns to bust. Its AI capex is smaller and the wealth channel much weaker: equities make up 13% of UK households' financial assets, versus 44% in the US. Missing the party also means skipping the hangover.
Which sectors stand to win most, and which risk being left behind?The winners sell the infrastructure or use AI to do more; the losers are those whose business model is the very task AI now performs.
The clearest winners are the suppliers of the build-out: semiconductors and chip equipment, utilities and grid operators, electrical equipment, construction, cooling and data centre real estate. They are already seeing it in their order books.
Software is mixed. AI is a powerful selling point, but it also threatens the per-seat pricing model: if one employee with an AI agent does the work of five, the customer needs fewer licences.
Most at risk are legacy IT services and business process outsourcing, call centres, parts of professional services, and media and advertising models that depend on search traffic. AI-based services may also disrupt online retail, including online travel agencies, as AI assistants increasingly do the browsing and the booking.
But don't write off every exposed sector. The Jevons paradox – cheaper supply raising demand – could favour some of them. Legal services is a good example: if AI makes contract review or legal advice much cheaper, demand may rise faster than the cost per task falls. Growth may also come from unexpected places. In healthcare, AI-driven drug discovery and diagnostics could open up new treatments, creating demand rather than merely cutting costs.
Ultimately, productivity gains depend more on the tasks employees perform than on the sector they sit in. Workers handling large amounts of data, text or graphics are likely to see the largest gains. The chart below, from our 2023 work, shows how the potential benefits of generative AI across tasks relate to the degree of digitalisation across sectors: the more digital a sector already is, the faster AI can travel through it.
In short, the winners will be those that build AI or use it to work smarter. The losers will be those whose core activities can increasingly be automated.
Growth, prices and trade How much of US growth in 2027 will come from AI capex, and what would growth look like without it?Today, more than a third. In 2027, probably less – which is exactly why the rest of the economy matters.
At first glance, AI looks like the engine of the entire US economy. Data centre construction, equipment investment and software spending have grown at a pace that makes their headline contribution to GDP growth look spectacular. But much of that money leaves the country straight away: from Taiwanese chips to servers assembled abroad, the hardware is largely imported. Netting out those imports, we estimate that AI-related investment accounts for 37% of US real GDP growth. Substantial, but a long way from the 'AI is the only game in town' narrative.
The more uncomfortable finding lies outside tech. Rather than lifting the overall growth rate, the AI boom seems to have cannibalised growth elsewhere. Strip out AI, and the rest of US private non-residential investment had fallen year-on-year for six consecutive quarters by mid-2026. Before 2021, tech and non-tech investment moved broadly in step; since then, they have moved in opposite directions. One explanation: shareholders reward companies that embrace AI, so capital budgets are being redirected towards tech at the expense of everything else. So the boom isn't so much about creating additional investment as redirecting investment from elsewhere in the economy.
What would US growth look like without AI? Not simply 37% lower. Part of the capital, engineers and electricity absorbed by AI would have found other uses. A world without the AI boom would most likely show weaker growth, but not by the full amount of AI's contribution – and with a more balanced investment mix.
For 2027, our plateau base case implies a smaller AI contribution to growth. That would give the non-tech economy room to breathe – but only if it is ready to take over.
For now, AI is a capex story, not a consumer story. And capex stories have a habit of ending with a hangover.
The productivity question: when, if ever, does AI show up in the statistics?In the US and China, it already does – partly. The big gains are still to come, and may arrive abruptly.
It depends on where you look. In the US, labour productivity has picked up markedly since the start of the AI boom. Part of that comes from high-skilled services, exactly where you would expect AI to show up first. But part of it reflects the enormous data centre investments, which are capital-heavy and need very little labour. Total factor productivity – the best available measure of gains from technological progress – has improved decently in the US, but without an exceptional acceleration. While AI-related sectors are providing a significant boost to several Asian economies, this largely reflects rapid investment and higher capital utilisation rather than a sustained improvement in underlying productivity. However, in China, we've seen labour productivity growth pick up in the last two years, breaking what had been an extended downtrend as Chinese companies race to incorporate AI in workflows. In the eurozone, which lacks comparable AI investment, labour productivity growth remains lacklustre, with very few exceptions, like for example, in the Netherlands.
The technology holds real promise for broad-based productivity gains. But reaping them requires wider adoption and investment in infrastructure and skills, both within companies and across the economy. That suggests a J-curve: heavy upfront intangible investment – time spent learning new skills and reorganising workflows – could initially mute measured productivity before the investment pays off, possibly quite abruptly. Electrification is the classic precedent: the electric motor arrived in the 1880s, but factory productivity only took off in the 1920s, once factories had been rebuilt around it.
And even then, a shift of the workforce towards sectors where productivity gains are harder to achieve – think healthcare and care work – would dampen the macroeconomic effect. Measurement doesn't help either: when AI makes a free digital service better, GDP statistics barely notice.
Still, after decades of slowing productivity growth, AI is likely to be a game changer. The question is not so much whether it will show up in the statistics, but when. In 1987, Robert Solow quipped that you could see the computer age everywhere but in the productivity statistics. It took about a decade to prove him wrong.
Is AI inflationary or deflationary? Electricity, memory chips and construction costs point one way; long-run efficiency gains point the other.Inflationary today, disinflationary tomorrow – but don't hold your breath for the outright deflation Silicon Valley promises.
It depends on your time horizon. For now, the effect runs in the inflationary direction. AI's enormous energy demand is adding to the current energy shock, memory chip prices have surged, and the scramble for electricians, transformers and construction capacity is pushing up costs. Meanwhile, the investment boom is pouring fuel on the fire of a US economy already running with above-target inflation.
In the longer run, once the technology lifts productivity, it should lower unit labour costs and exert disinflationary pressure across the economy. Like most technological breakthroughs, AI will probably end up being disinflationary. But the effect will be concentrated in services and much smaller for goods with physical inputs. Algorithms can't make steel, copper or concrete cheaper.
There is also a less comfortable twist. AI allows companies to price dynamically, adjusting prices to what each customer is willing to pay and thereby capturing more of the consumer surplus. That could make some prices stickier rather than lower. Together with the physical constraints, this makes the outright deflation Sam Altman envisages rather unlikely.
For AI itself, the picture is different. As we argued in 2024, we expect a downward price trend for AI services, as with other software categories, and at the sector level we continue to hold that view. Competition between model providers should keep the pressure on.
For central banks, this means the AI disinflation dividend is a story for the second half of the decade, not for 2027. Until then, the boom adds to demand faster than it adds to supply – the textbook recipe for inflation, not deflation.
How is AI reshaping global trade and investment flows, from Taiwanese chips to Dutch lithography?AI is redrawing global trade around a single supply chain – and rewarding the countries that own its choke points.
AI is increasingly sorting the global economy into winners and laggards. The IMF has raised its outlook for economies benefiting from the AI investment boom, particularly those embedded in the global technology supply chain, while countries outside it see much less of a boost. Taiwan is riding booming semiconductor demand, South Korea is benefiting from demand for high-bandwidth memory, and the effects travel upstream to the suppliers of advanced chipmaking equipment, including the Netherlands.
This illustrates how AI is reshaping both trade and investment flows. Spending on data centres and computing capacity in the US drives demand for chips from Asia, which in turn requires investment in semiconductor capacity and equipment from Europe, Japan and the US. The result is an international AI investment chain, with growth increasingly flowing to the countries that hold its critical links. It also explains a good part of the surge in the US import bill: every data centre built in Texas shows up in Taiwan's export statistics.
Trade policy is the second force reshaping the chain. Export controls on advanced chips to China, tariffs and subsidy programmes such as the US Chips Act (or direct government stakes in companies) are pushing companies to build capacity closer to home or in friendly countries. That makes the chain more resilient on paper, but also more expensive – another reason why the deflationary promise of AI may take longer to materialise.
The flip side is concentration risk. If the chain snaps – through a demand slump, an escalation of export controls or a Taiwan crisis – the countries benefiting most today would feel it first and hardest.
What does AI mean for labour markets, and for how central banks read them?So far, AI is reshaping who gets hired rather than how many are employed – which makes it a real-time headache for central banks.
Evidence on AI's labour market impact remains fragmented, and the economy-wide effect is still limited. If history is any guide, fears of mass unemployment are overdone: with every major technology of past centuries, growth was strong enough to create jobs elsewhere, even as demand for some types of labour fell. But if adoption is so fast that labour demand and supply can't adjust in time, unemployment could rise temporarily.
The first cracks are showing at the entry level. In the US, job growth has remained positive but weaker in sectors with high AI exposure; evidence from the eurozone is mixed. The Dallas Fed finds that employment among young workers in AI-exposed occupations has weakened, mainly reflecting lower hiring rather than more layoffs. According to the Stanford Digital Economy Lab, employment among 22-25-year-olds in highly exposed occupations was around 19% below where it would have been by June 2026 had it kept pace with less-exposed occupations. In China, we see similar pressures on entry-level work reflected in rising youth unemployment. The Chinese government has planned training and job replacement policies to help alleviate any negative effects of AI on employment. For developing Asia, particularly India and the Philippines where outsourcing sectors are highly exposed to AI, the evidence points to adaptation rather than decline. AI is changing the nature of outsourced work, not reducing demand for it.
AI is not firing people; it is quietly not hiring them. Still, none of this points to mass displacement. Yet. And with ageing populations and persistent labour shortages, the real question may be whether shortages or AI turn out to be the bigger problem.
For central banks, AI is less of a short-run issue than you might expect. Higher productivity growth combined with more muted job growth could be the healthy sign of an economy absorbing a new technology, and come with more moderate inflation. The tricky part is reading it in real time. A soft payrolls print could signal either a weakening economy or a more productive one – and the right policy response would be very different. Get it wrong, and a central bank either cuts rates into a productivity boom or sits on its hands as the economy weakens.
Who pays? Is the boom still funded from cash flows, or are hyperscalers increasingly turning to debt?Still mostly from cash flows – but the cushion is thinning and the borrowing has begun.
The largest hyperscalers have so far paid for the AI build-out out of their own pockets, which is the biggest difference from the dotcom and railway booms. But capex is absorbing a rising share of operating cash flow, squeezing free cash flow and leaving less room for share buybacks. For companies that used to return cash to shareholders at a record pace, that is a notable shift in priorities.
Borrowing is stepping up. Several hyperscalers, such as Amazon, Alphabet, Meta, and Oracle have issued jumbo bond deals since 2025, with Oracle the most leveraged of the group. Equity markets are being tapped too: several big tech firms announced plans to raise equity in June. None of this is alarming on its own – these are investment-grade companies with strong balance sheets – but it marks a change of phase. Cash-funded booms are self-limiting: they stop when the cash runs out. Debt-funded booms can run further, and fall harder.
The key is to distinguish between the players. The cash-rich hyperscalers can absorb a disappointment in AI returns; their core businesses in advertising, cloud and software keep generating cash regardless. The neoclouds and AI labs are a different story. They depend entirely on outside money – venture capital, private credit, vendor financing and strategic investors – and their business models only work if revenue keeps growing spectacularly. They are the most likely point of stress if financing conditions tighten.
In between sits a growing grey zone of leases, joint ventures and special purpose vehicles that keep debt off the hyperscalers' own books.
The direction of travel is clear. The boom started as a self-funded venture by the richest companies in the world. It is gradually turning into a credit story.
Leases, SPVs, private credit: how opaque has AI financing become?More opaque than the hyperscalers' balance sheets suggest – but so far, the risk rests on some of the strongest borrowers in the world.
A growing part of AI financing is moving off balance sheet. Special purpose vehicles and joint ventures, such as Meta's Hyperion data centre financed with Blue Owl, long-term leases and GPU-backed loans allow companies to fund the build-out without the debt appearing directly on their own books. Securitisation of data centre assets through asset-backed securities and commercial mortgage-backed securities is growing as well, bringing a wider pool of investors into the game.
Leases are a particular blind spot. They are recognised as on-balance-sheet commitments only once contracts are final; until then, the extent of incremental lease liabilities is uncertain. There is also the question of who carries the risk if the tenant walks away after the initial term. Although initial lease terms of 15 years are not uncommon, these can still be shorter than the economic life of the underlying infrastructure, leaving some residual risk around renewal or re-leasing.
That said, risk has to be assessed contract by contract. The largest technology firms, with very solid balance sheets, are well placed to take on additional liabilities, and much of the off-balance-sheet structure ultimately rests on their creditworthiness. The problem is less hidden insolvency than hidden concentration: it is hard to see how much of the system leans on the same handful of tenants.
Opacity also complicates the macro picture. When financing is spread across SPVs, private credit funds and securitisations, it becomes harder for investors, regulators and central banks to see where risks are concentrated – and harder to judge how a shock would travel.
Looking ahead, capital may eventually become a major constraint on the AI build-out, alongside permitting and access to power. The more the industry relies on creative financing, the more it depends on investors' continued willingness to lend. Financial engineering can prolong a boom, but it can't make the returns appear.
How exposed are banks, and is private credit the shadow banking of this cycle?Direct bank exposure looks modest; private credit is the obvious weak spot – but contagion would run through markets rather than bank failures.
Banks' direct exposure to AI looks limited. The hyperscalers fund themselves mainly through cash flow and bond markets rather than bank loans. Indirect exposure is harder to gauge: banks lend to private credit funds, data centre developers and construction firms.
Private credit is the obvious weak spot. Is it the shadow banking of this cycle? Partly. It has less of the maturity mismatch that made pre-2008 shadow banking so fragile: much of the capital is locked up in closed-end funds, so investors can't run. But it shares other features: opacity, infrequent valuation marks and leverage on leverage, with funds borrowing from banks to lend to borrowers that are themselves highly leveraged. And it is increasingly exposed to AI through loans to neoclouds, GPU-backed financing and data centre developers.
The pressure point is the semi-liquid vehicles sold to retail and wealth clients. They promise periodic liquidity on assets that are anything but liquid. In a downturn, redemption requests could force managers to impose gates, damaging confidence across the asset class. So far, these vehicles are not core to the AI build-out, but they are where a shock could turn into a story.
If stress does materialise, we would expect contagion to run through tighter financial conditions and wider credit spreads across the economy rather than through bank failures. That is less dramatic than 2008, but not harmless: a repricing of credit risk would raise funding costs far beyond tech, hitting the very non-tech investment that is already struggling.
Banks may well escape an AI bust largely unscathed. The economy they lend to may not.
Vendor financing déjà vu: should we worry when chipmakers fund their own customers?Worth watching, but this is not Lucent and Nortel all over again – mainly because the balance sheets are much stronger.
The dotcom precedent is uncomfortable. Lucent, Nortel and Cisco lent money to telecom start-ups so they could buy their equipment. When the customers went bust, the suppliers took the hit, and much of the reported demand turned out to have been financed by the sellers themselves.
Today, there are echoes. Chipmakers are taking stakes in AI labs and neoclouds that then buy their chips. The same handful of firms raise money, buy chips, lease compute and book revenue off one another. The concern is less solvency than signal: circular deals inflate reported demand and blur true end-demand. Revenue that only exists because the supplier paid for it isn't demand.
But the picture differs in important ways. Many of these contracts appear to be normal commercial arrangements, and AI labs also generate fast-growing revenues from customers outside these related deals. AI-related revenues are still only part of the much larger businesses of the hyperscalers. And the macro backdrop is very different: the overall US corporate debt-to-GDP ratio is not worrisome, in stark contrast to the leverage that built up before the dotcom bust and the global financial crisis. Circularity in a cash-rich system is a transparency problem; circularity in a leveraged system is a solvency problem.
That does not mean investors can relax. Circular deals create concentration risk: if one key AI lab stumbles, the shock would travel quickly through its suppliers, landlords and investors, who are often the same companies. And they make it harder to judge how much genuine end-demand there is for AI – precisely the question on which the whole boom rests.
The test is simple: follow the money until it reaches a customer who isn't also an investor. The longer that trail gets, the more nervous we should become.
Higher Fed rates helped end the dotcom bubble. Could monetary policy or bond yields pop this one too?Probably not as the trigger – but monetary policy could make any bust more painful, because the safety net is thinner than in 2001.
In 1999-2000, the Fed hiked rates to 6.5% before the dotcom bubble burst, then cut by almost five percentage points in 2001. This time, an energy shock is keeping inflation above target. Actual rate hikes and more rate hikes to come could bring both the Federal Reserve and European Central Bank closer to risky territory.
High policy rates do not necessarily stop AI investment first. If expected returns on AI remain very high, capital may keep flowing in while financing becomes uneconomic for lower-return investment elsewhere. Tight money could deepen the split between tech and non-tech investment rather than end the boom.
At the moment, we expect hyperscaler funding needs to increase further as investment in AI infrastructure, data centres and power capacity accelerates. We forecast total issuance of around US$280bn in 2027, including approximately US$190bn in USD and US$65bn in EUR (€60bn). For European credit markets, we estimate a net TMT supply number of €103bn, which includes US$65bn coming from hyperscalers.
The long end of the yield curve matters more than the policy rate. As the AI build-out becomes increasingly debt-funded, higher bond yields and term premia raise the cost of financing long-term investments, from data centres to power plants. A sustained rise in long-term yields would therefore hit hardest where the build-out depends most on external funding.
The bigger issue is the safety net. If the bubble bursts, central banks can't come to the rescue as aggressively as in 2001 while inflation is above target. Fiscal space is also far more limited than a quarter of a century ago.
But don't rule out a different kind of rescue. AI is not just an economic tool; it is also about power – geopolitical and technological. If things went south for the sector, some form of government support would be conceivable, from public procurement to guarantees or targeted support for strategically important companies. The dotcom bust was left to the market. An AI bust might not be.
Monetary policy is unlikely to pop this bubble. But it could decide how hard the landing is – and Washington may decide who gets a parachute.
Bubble or not? What do valuations and revenue gaps tell us?Bubble-like pockets, but not a bubble across the board: the leaders are hugely profitable, while the real uncertainty sits with the AI labs and the revenue gap.
Valuations first. At its 2000 peak, Cisco traded at well over 100 times earnings. Today's AI leaders are expensive, but profitable, and analysts expect earnings growth to bring their multiples down considerably. Microsoft's P/E is expected to fall from 29.2x based on fiscal 2026 earnings to 21.9x in 2028, Amazon's from 28x based on 2025 earnings to 21x in 2027, and Alphabet's from 20.9x to 17.9x over the same period. With earnings estimates being higher than a couple of months ago, that does not look particularly stretched. The larger uncertainty sits with the AI labs, whose valuations follow the venture capital playbook: spectacular revenue growth, uncertain long-term economics.
Then the revenue gap. Capex is running ahead of AI revenues, as it can take several years for investment to translate fully into revenues. Amazon, Microsoft and Alphabet have invested around US$600bn over 2023-25. As a rough rule of thumb, every dollar of AI infrastructure may need to generate 40-50 cents of annual revenue, implying US$240-300bn a year – although not all of this capex was AI-related. That looks large, but less so next to labour costs. At US$100,000 per employee, US$300bn is the cost of three million workers. AI doesn't need to replace them: a 20% productivity gain across 15 million employees would deliver the same value. Consumers alone won't close the gap; the money has to come from enterprises.
Two caveats. Concentration: the weight of the largest tech stocks in the S&P 500 exceeds the dotcom peak, so any disappointment would hit the whole index hard. And circularity in financing and revenues makes true end-demand harder to measure.
Finally, a bubble in prices doesn't mean the technology is a dud. Railways had a bubble. So did the internet. Both still changed the world.
What could end the boom prematurely: disappointing demand, power bottlenecks, a cheaper-model breakthrough, or Taiwan?Most likely not a single trigger, but a slow squeeze: overcapacity, eroding margins and tighter financing if the revenue gap fails to close.
Start with the usual suspects. Demand could disappoint if enterprise adoption stalls and pilots fail to turn into profits. Power bottlenecks are more likely to cap the pace of the boom than to end it, and could even stretch it out. A Taiwan crisis remains a low-probability, extreme-impact event.
Cheaper models are the most intriguing risk. The DeepSeek shock of January 2025 wiped almost US$600bn off Nvidia's market value in a single day. Cheaper compute can raise demand – the Jevons paradox – but higher volumes can come with lower margins. That makes the profitability of AI labs such as OpenAI and Anthropic the big question mark. If it disappoints, the hardware will still be needed, but the build-out would likely slow. Nvidia's exceptionally high margins could also normalise if competition increases or the scarcity value of leading-edge compute declines.
Missing from most lists is financing: rising bond yields, a credit event at a leveraged neocloud or private credit fund, or an energy shock that keeps central banks hawkish.
Ultimately, we see the biggest risk in overcapacity. Continued innovation in chips, more efficient models and optimised algorithms could eventually create an imbalance between supply and demand, pushing down utilisation and returns. For now, though, the industry is still struggling to scale compute and secure enough power, while new business models and applications keep emerging.
There is one more way to read today's capacity commitments: as strategic entry deterrence. Announcing gigantic investment plans discourages competitors from entering the market – and some of those plans may never be fully executed if returns disappoint. That would be a quieter ending than a crash. Not with a bang, but with a series of downward revisions to capex guidance.
If tech stocks fall 30%, how much does the wealth effect hit US consumption?Less than you might think, but more than during the dotcom bust – and the real damage would come through investment and jobs.
US equity wealth is highly concentrated. The top 20% of households by income (earning more than $155k a year) hold 84.1% of equities, mutual funds and defined-contribution pension assets. That limits the wealth effect. Fed research suggests the marginal propensity to consume out of wealth fell from around 3.5 cents per dollar (1964-2011) to 2.6 cents in 2020.
A 30% stock market correction would wipe out roughly $24.5tn of household wealth. At 2.6 cents per dollar, that means a drop in consumer spending of around $640bn, or 2.9% of nominal consumer spending (an annualised $22.3tn in August). With wealth even more concentrated than in 2020, the multiplier is probably weaker; at 2.2 cents, the hit would be around 2.4%. That is a level effect, typically playing out over one to two years – but a big number nonetheless.
History offers some comfort: during the dotcom bust, US consumer spending barely flinched. But it could be worse this time. First, wealthy households are currently the only ones holding up spending; the bottom 60%, who spend roughly as many dollars as the top 20%, are squeezed by tariffs and higher fuel prices. Second, the Fed has less room to cut than in 2001. Third, the credit cushion is thinner: rising delinquencies on car loans and credit cards show stress building at lower incomes.
The good news: this is not 2008. US household debt stands at around 70% of GDP, the same as in 2001 and well below the 100% reached in 2007.
In the end, the wealth effect is the smaller channel. After the dotcom bust, business investment fell by 11% in two years. IT equipment was the least of it, falling just 6%, transport equipment fell 21% and manufacturing buildings plunged by a whopping 55%. Tech may light the fuse, but the explosion happens elsewhere.
What would a tech sell-off mean for the dollar and FX markets?Not necessarily the classic safe-haven dollar rally – this time, a tech sell-off could well hurt the dollar.
The usual playbook says risk-off means dollar up. But an AI-led correction would be a US-centric shock. Foreign investors hold large, partly unhedged positions in US equities, built up over a decade of American outperformance. A sell-off in US tech could trigger repatriation and higher hedge ratios, both dollar-negative – as in the 'sell America' episode of April 2025. The IMF estimates the dollar would fall by around 6% in an AI-led equity correction.
The rates channel points in the same direction. Negative wealth effects, weaker consumption and slower US growth would eventually push the Fed towards rate cuts, narrowing interest rate differentials against the dollar. The timing would depend on inflation: with prices still running above target, the Fed may cut later than markets hope, which could limit the dollar's fall in the early stages.
Among the winners, the yen and the Swiss franc would play their traditional safe-haven role. The euro could benefit relatively, given Europe's lower exposure to both AI capex and equity wealth (4Q). A tech crash made in America would, for once, be a reason to hold European assets rather than flee them.
The losers would be the currencies of Asian tech exporters, notably the Taiwan dollar and the Korean won, whose economies are leveraged bets on AI demand. They would come under heavy pressure, although intervention by local authorities and the legacy of huge trade surpluses would cushion the blow somewhat.
The bottom line: in an AI bust, the dollar may lose its reputation as the place to hide. Not because the world has found a better safe haven, but because this time the fire would start in the safe house.
Our base case for 2027: boom, plateau or bust, and which signposts should readers watch?Our base case is a plateau at altitude: the boom continues in 2027, but its contribution to growth peaks. A bust remains the main risk scenario.
Early indicators point to tight semiconductor supply into 2028, suggesting the investment cycle still has legs. But as capex growth slows, AI's contribution to US growth should fade.
The difference between the two scenarios matters enormously for the US. A plateau would give the non-tech economy room to breathe: capital, energy and workers no longer absorbed by AI could flow back, allowing non-tech investment – and potentially employment – to rebound. A bust would be a very different animal: an abrupt choking off of tech investment, similar to 2001, combined with a negative wealth effect on consumers through falling stock markets. And this time, central banks would have less room for rate cuts as inflation remains their main concern.
Which signposts should readers watch? For the boom itself, the key indicators are hyperscaler capex guidance, Taiwanese order books and lead times, and AI revenues relative to capex. Markets will focus on realised AI revenues at the large technology firms, margins on incremental revenue and how the next phase of the build-out will be funded; figures that disappoint relative to company budgets and analysts' forecasts could trigger a sell-off.
On financing, credit spreads on AI-related debt, private credit flows and redemptions, and bond yields and term premia will show whether investors remain willing to fund the build-out. In the real economy, the questions are whether non-tech investment finally recovers, how hiring in AI-exposed sectors develops, and what productivity, grid connection and power data are telling us.
The question for 2027 isn't whether AI will change the world. It's whether anyone gets paid for it in time. If earnings fail to match sky-high expectations, the plateau could turn out to be a ledge.

Legal Disclaimer:
MENAFN provides the
information “as is” without warranty of any kind. We do not accept
any responsibility or liability for the accuracy, content, images,
videos, licenses, completeness, legality, or reliability of the information
contained in this article. If you have any complaints or copyright
issues related to this article, kindly contact the provider above.


Comments
No comment