


When Climate Data Is Transformed Into Visuals Some People And Places Get Overlooked


Billions of people around the world live in places and situations that are highly vulnerable to climate change, such as parts of Africa, Asia and small Pacific islands.
Data visualisations have become an important way of communicating climate change. Warming is represented through colours, emissions through lines and bars, and floods and fires through maps and animations. These visualisations can make an enormous and complicated problem easier to understand, but they can also shape how people feel about it.
Crucially, some visualisations don't tell the full story.
I explored this in my new research with 34 social media users in the UK and Poland. I showed participants climate data visualisations and asked them how they felt and what they did with the information. Participants described worry, fear, sadness, anger and concern, but also curiosity, surprise and pleasure suggesting that visualisation can make unpalatable data more enjoyable.
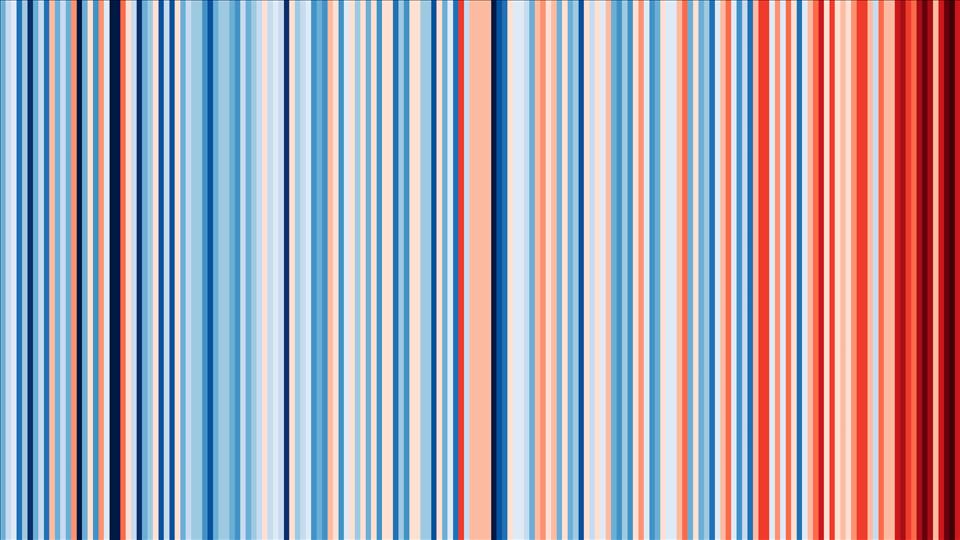
The warming stripes for Poland (above) is a visualisation that shows temperature changes through coloured stripes. One participant said this visualisation looked“so pretty, nice and interesting”. But once they understood what the colours represented (red for warm temperatures; blue for cooler temperatures), their reaction changed, and the image became upsetting. The visualisation did more than show climate change: it changed how the participant experienced it.
What data visualisation leaves outOne of the most revealing moments in my research came from a meteorologist from Tonga who used to live in the UK. They first saw the warming stripes visualisation shared on social media, but Tonga was not shown as a location. They commented on the visualisation, asking whether stripes could be created for Tonga. They wanted to see what was happening at the scale of individual islands. They then went to the interactive version, where users can select locations to create their own stripes, but they could not create one for Tonga because the data wasn't accessible for specific islands.
The visualisation showed temperature changes across broad regions, including the Pacific. But the participant wanted to see what was happening at the scale of particular islands. That visualisation prompted them to think about what could be done. They shared it with colleagues, and they decided to reproduce something similar using their own data.
The problem was not that the global visualisation was inaccurate. It was that accuracy at a global scale did not guarantee visibility at a local one. For communities such as those on Tonga (an island that contributes only a fraction of global emissions yet bears the brunt of climate change ), this local visibility matters.
So who are visualisations making climate change“visible” for? For the participant from Tonga, climate change is closely connected to land, the sea, community and everyday life. They explained that data visualisation needs to reflect local context yet engage audiences more widely to convey an urgent need for climate action.
What happens after seeing the dataClimate data visualisation is not just a technical exercise. Researchers usually ask whether a graph is accurate, clear and easy to understand. But we should also ask who is represented, who is missing and whose experience the data allows us to see.
What people see can shape how they feel about climate change and what they believe they can do about it. My research found that emotional responses could lead people to share information, discuss it with others, change their everyday practices and sometimes inspire more formal political engagement.
But strong emotions did not automatically lead to action. People were more likely to describe taking direct climate action when they also felt there was something they could actually do at a local or national level. A sense of agency can help determine what happens after people encounter climate information.
The challenge for climate communication is not simply to find better and more accurate ways of showing the scale of the crisis. It is to ask whether, when climate change gets transformed into data, audiences are still able to see the people behind the numbers – and whether what is being shown gives people not only a reason to care, but a sense of what they can do.
Making climate change visible is only the first step. The harder and more critical challenge is considering whose experiences we see, whose are left out, and what happens after we see them.


Legal Disclaimer:
MENAFN provides the
information “as is” without warranty of any kind. We do not accept
any responsibility or liability for the accuracy, content, images,
videos, licenses, completeness, legality, or reliability of the information
contained in this article. If you have any complaints or copyright
issues related to this article, kindly contact the provider above.


Comments
No comment