


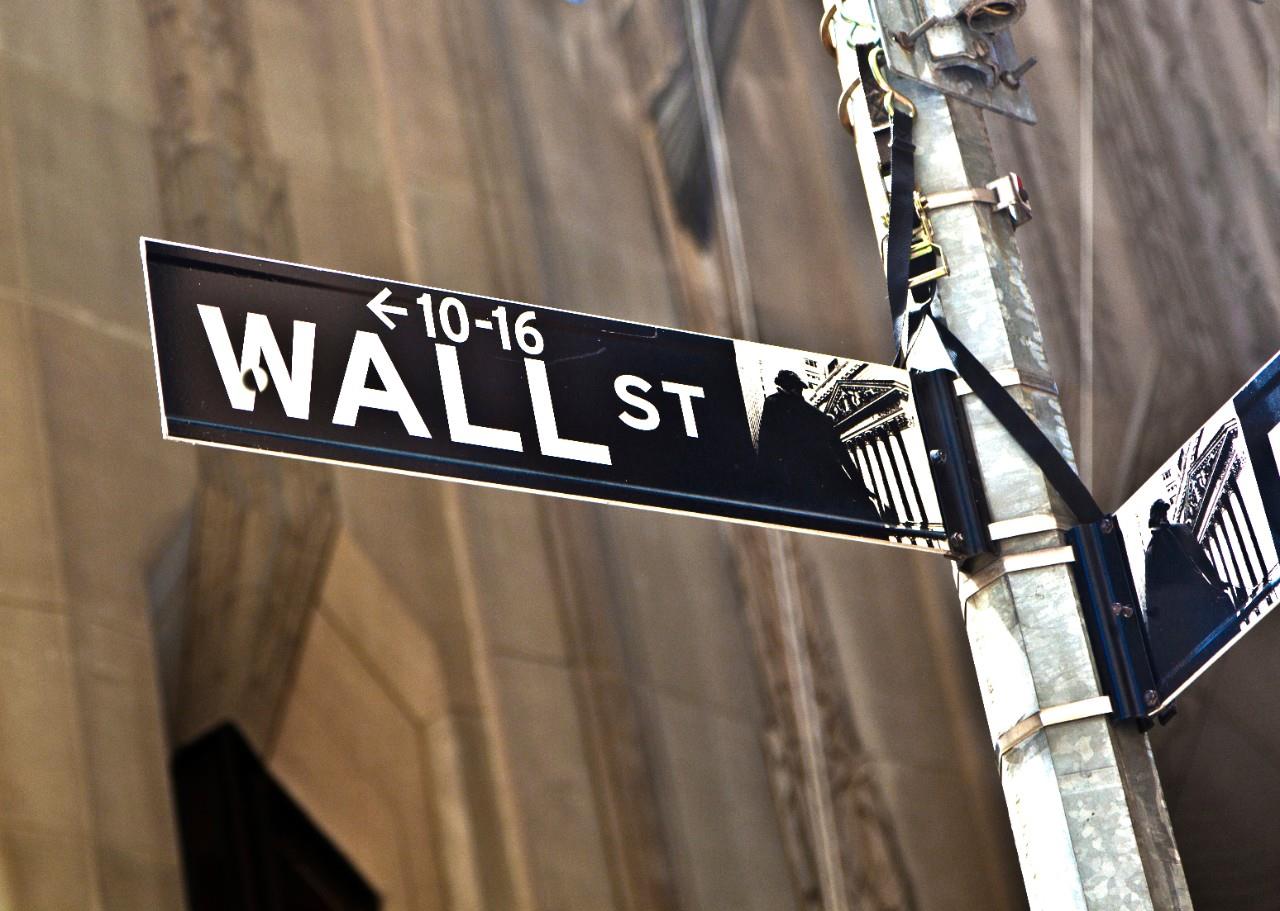
Tech Sell-Off Rattles Stocks: What Traders Need To Know


Around $660bn vanished from US stocks in a day as the AI trade wobbled. Earnings season now has to decide whether that was a wobble or a warning.
Open an online IG accoun Source: Adobe images Earnings season Technical analysis US stocks Oil InvestingWritten by
Chris Beauchamp
Chief Market Analyst
Publication date 2026-10-19T11:31:09+0100 What the data reveals about last week's sell-offIt was not, by any reasonable measure, a good week to own chipmakers, with the Nasdaq falling 2.19% on Friday alone, the Philadelphia semiconductor index notching an eighth straight daily decline and roughly $660bn wiped off the value of US equities in the space of a single session.
The trigger was CoreWeave, or more precisely a growing unease about how much it owes, and that proved enough to prompt a broad rethink of anything with AI anywhere in the pitch deck. The effects travelled well beyond Wall Street, with South Korea's KOSPI dropping nearly 8% in one session – something its finance ministry put down to the market's heavy weighting in AI-linked stocks, which is a polite way of saying that everyone owned the same thing – while Indonesia, for reasons entirely its own, managed its steepest one-day fall in 28 years after MSCI warned of a possible downgrade.
None of this has done much damage to the year as a whole, since the S&P 500 is still up 11.89% year-to-date, although October, at a rather less impressive 0.10%, is another matter.
The bull case: why this could be a healthy pullbackStart with the numbers, which are less alarming than the headlines might suggest: the S&P 500 sits only about 2.4% below its 52-week high of 7844.52, and it is still up 1.43% over one month and 1.67% over three. If this is a crash, it's a remarkably polite one.
The VIX seems to agree, having risen 0.95 points to 16.22, which leaves it some way short of the 20-plus readings that usually accompany genuine fear. Nor have the dip buyers gone anywhere, given that Japan's Nikkei snapped a six-session losing streak and the KOSPI clawed back 2.05% almost as soon as the dust had settled.
Europe, meanwhile, barely seemed to notice, with the STOXX 600 rising 0.7% on Friday to a three-week high and logging its best week since late June, helped along by solid earnings from companies that have never claimed to be AI plays in the first place. Financials, energy, industrials and defence don't need a chatbot to make money, and the fact that US 10-year Treasury yields posted their largest weekly decline in more than a year has removed at least one source of pressure for the time being.
Why earnings season could decide the debateThird-quarter results from Tesla, Meta, Netflix, IBM and GM are in focus this week, with the rest of the megacaps following close behind, and analysts, as is customary at this point in the cycle, are broadly optimistic.
Good numbers from the biggest names could restore confidence quickly, but the catch is that analysts can't seem to agree on what good actually looks like, with Tesla EPS estimates ranging from $0.05 to $0.70 and Eli Lilly's from $4.65 to $10.68. With spreads that wide, a beat may end up saying more about the forecaster than the company, and any disappointment is likely to be punished with some enthusiasm.
The bear case: why this could be more than a blipThe trouble with a market led by one theme is that it can be led down by that theme just as easily, and since tech and AI make up such a large share of S&P 500 market capitalisation, a sustained rotation out of these names could hit the index far harder than the headline count of stocks would suggest. Korea has just provided a preview.
Then there's oil, with Brent touching $110 a barrel for the first time since May thanks to a combination of Middle East supply fears and a Ukrainian strike on a Russian refinery. Expensive energy has a habit of turning up in CPI sooner or later, which would give the Fed yet another reason to sit on its hands and consumers one more reason to spend less.
Yields have eased, but only from uncomfortable to slightly less uncomfortable, with the US 10-year sitting around 5.1% and the 30-year at 5.44%. At those levels bonds start to look like a perfectly reasonable alternative to expensive growth stocks, which means multiples are likely to stay under pressure, and riots in France alongside a widening Middle East conflict complete a backdrop that is hard to describe as reassuring.
Historical parallels and what they tell usPrecedent, unhelpfully, cuts both ways. In the fourth quarter of 2018, rising yields and a Fed that insisted on tightening took the S&P 500 down almost 20% from peak to trough, while in 2022 the repricing of rates knocked roughly a third off the Nasdaq, with long-duration tech stocks taking most of the punishment.
Then there's April 2025, when the tariff shock pushed the S&P 500 to the edge of a bear market, only for the index to be back at record highs within three months as if nothing much had happened. This time the difference may well come down to yields and oil, since if both keep climbing then 2018 and 2022 look like the better guides, whereas if they fade, April 2025 might be the more useful template.
What could signal a turning pointA few things to watch before deciding which one this is:
-
The semiconductor index – ending the losing streak would be a start
The VIX – a move above 20 would suggest this has stopped being a rotation
Treasury yields – a sustained drop in the 10-year below 5% could take some pressure off valuations
Brent crude – a retreat from $110 would ease inflation worries, if not cure them
Megacap earnings – beats from Meta, Alphabet, Microsoft and NVIDIA could bring the dip buyers back in force
If the megacaps deliver, the bulls may well be back in charge by November and last week will be remembered, if at all, as a buying opportunity, but if they don't, the sell-off may only be getting started.
Important to knowThis information has been prepared by IG, a trading name of IG Markets Limited. In addition to the disclaimer below, the material on this page does not contain a record of our trading prices, or an offer of, or solicitation for, a transaction in any financial instrument. IG accepts no responsibility for any use that may be made of these comments and for any consequences that result. No representation or warranty is given as to the accuracy or completeness of this information. Consequently any person acting on it does so entirely at their own risk. Any research provided does not have regard to the specific investment objectives, financial situation and needs of any specific person who may receive it. It has not been prepared in accordance with legal requirements designed to promote the independence of investment research and as such is considered to be a marketing communication. Although we are not specifically constrained from dealing ahead of our recommendations we do not seek to take advantage of them before they are provided to our clients. See full non-independent research disclaimer and quarterly summary.

Legal Disclaimer:
MENAFN provides the
information “as is” without warranty of any kind. We do not accept
any responsibility or liability for the accuracy, content, images,
videos, licenses, completeness, legality, or reliability of the information
contained in this article. If you have any complaints or copyright
issues related to this article, kindly contact the provider above.


Comments
No comment