



GBP/USD Signal 01/10: Bearish Flag


- Sell the GBP/USD pair and set a take-profit at 1.3100. Set a stop-loss at 1.3350. Timeline: 1-2 days.
- Buy the GBP/USD pair and set a take-profit at 1.3350. Add a stop-loss at 1.3100.
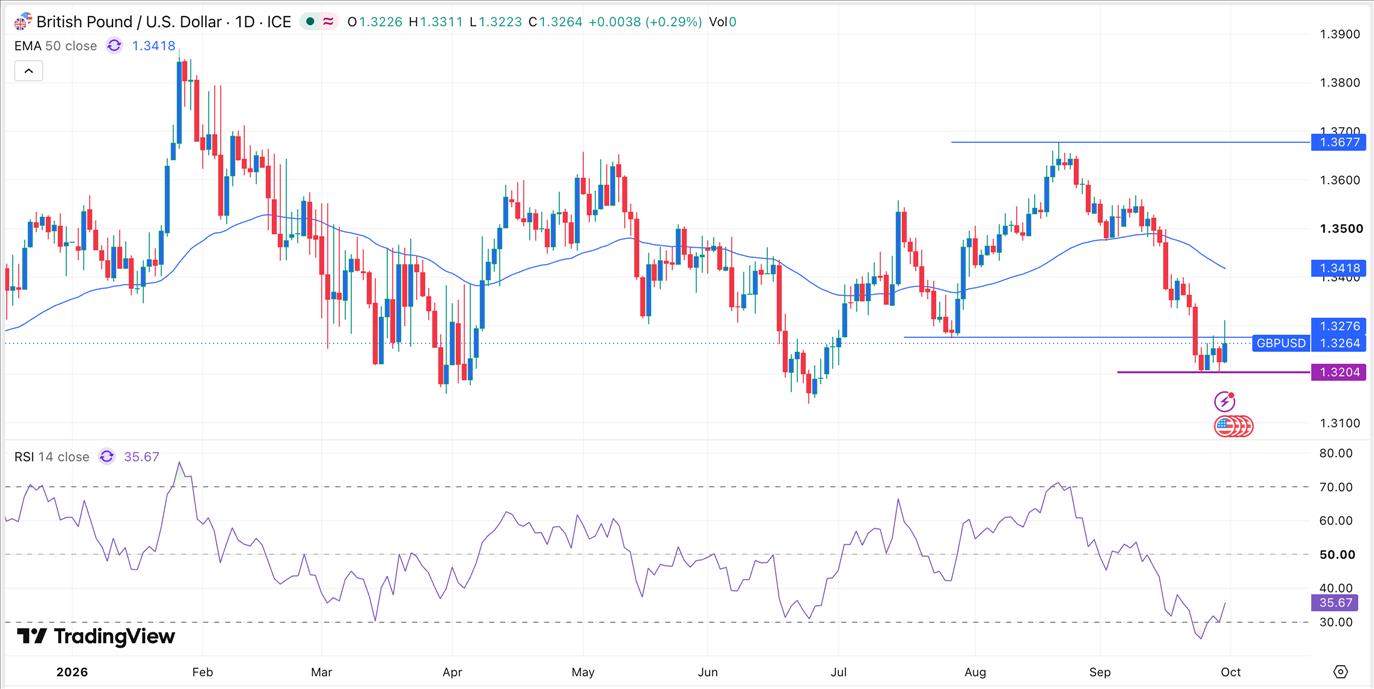
The GBP/USD pair has moved sideways this week as the recent sell-off faded. After dropping to 1.3204 on Monday, the pair has stabilized at 1.3263, which is still substantially lower than the August high of 1.3677.
US Nonfarm Payrolls and PMI Data AheadThe GBP/USD pair has been in a downward trend in the past few weeks. This sell-off continued after the Federal Reserve and the Bank of England (BoE) diverged on interest rates.The Fed decided to hike interest rates by 0.25% and hinted that more hikes were on the way. On the other hand, the Bank of England (BoE) left interest rates unchanged, with officials hinting that they will need to hike later this year.The GBP/USD pair is reacting to several important data this week. For example, the Conference Board published a weak consumer confidence report, which dropped sharply as gasoline and diesel prices soared.On Wednesday, a report by ADP showed that the private sector created over 90,000 jobs last month, much higher than what analysts were expecting. In another encouraging report, the headline and core personal consumption expenditure (PCE) rose at a slower pace than expected.Looking ahead, the next important numbers to watch will be the upcoming US and UK manufacturing PMI report. These are important numbers that provide information on the state of the economy. The flash data showed that the figure was above 50 in September, a sign that growth continued.
The most important data to watch will be the upcoming US nonfarm payrolls (NFP) report on Friday. This data is crucial because it forms part of the Federal Reserve's dual mandate. As such, a hotter NFP report, as we saw in August, will raise the possibility that the Fed will hike rates again.
EURUSD Chart by TradingViewAdvertisementGBP/USD Technical AnalysisThe daily chart shows that the GBP/USD pair has been in a steep sell-off in the past few weeks. It dropped below the important support level of 1.3263, its lowest level on June 28 this year.The pair is now forming a bearish flag pattern, which is made up of a vertical line and some consolidation. It has also retested the key level of 1.3263. Also, it remains below the 50-day moving average.Therefore, the path of the least resistance for the pair is bearish, with the next level to watch being 1.3204. A drop below that level will point to more downside, potentially to 1.3100.
Legal Disclaimer:
MENAFN provides the
information “as is” without warranty of any kind. We do not accept
any responsibility or liability for the accuracy, content, images,
videos, licenses, completeness, legality, or reliability of the information
contained in this article. If you have any complaints or copyright
issues related to this article, kindly contact the provider above.


Comments
No comment