

EUR/USD Signal 26/08: Pauses As Markets Await Fresh GDP Data


- Buy the EUR/USD pair and set a take-profit at 1.1800. Add a stop-loss at 1.1620. Timeline: 1-2 days.
- Sell the EUR/USD pair and set a take-profit at 1.1620. Add a stop-loss at 1.1800.
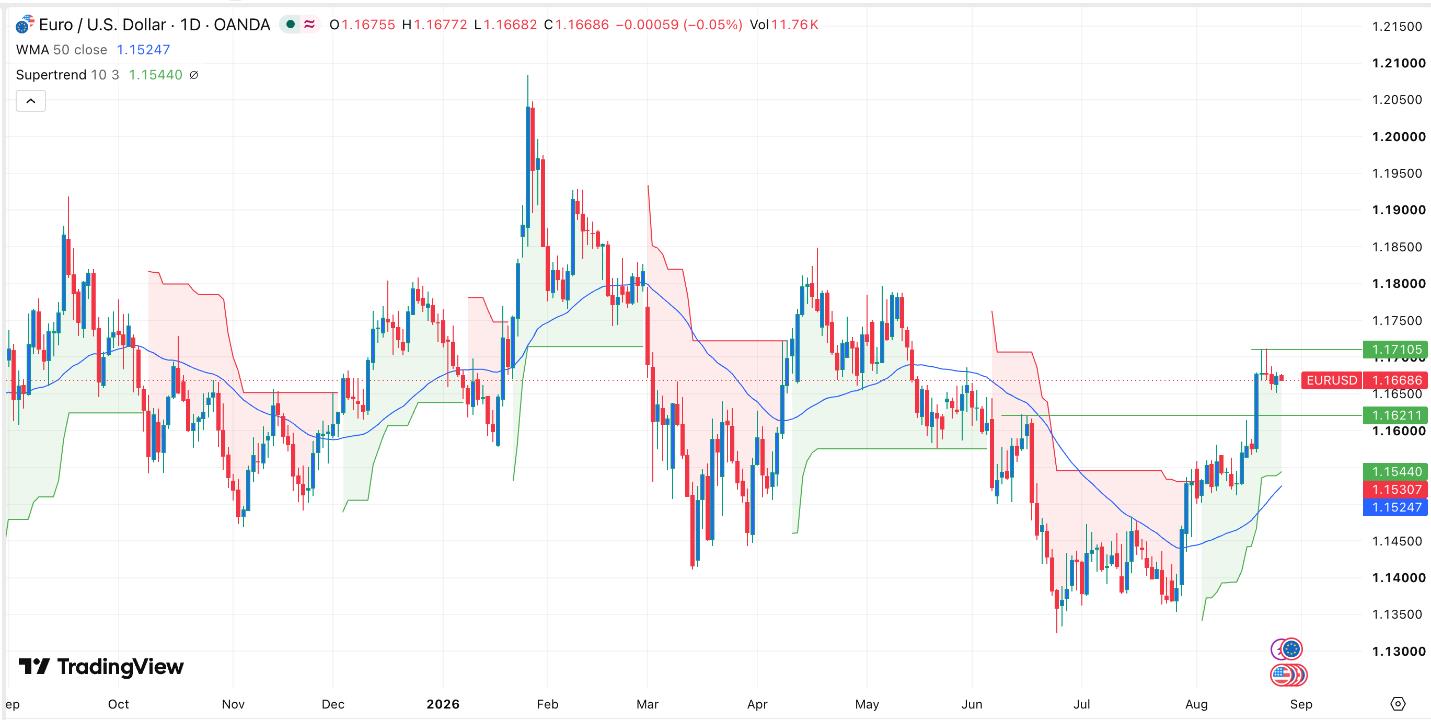
The EUR/USD pair was flat on Wednesday as traders focused on the important macro data from the United States and the upcoming Jackson Hole Symposium, where top central bank officials will talk. It was trading at 1.1672, a few points below this week's high of 1.1710.-p
img- src= data-src= alt="Table of prices EUR/USD 26/08/2026" lazy=loading title="Table of prices EUR/USD 26/08/2026" class="img-responsive center LazyLoading">US PCE and Jackson Hole SymposiumThe EUR/USD pair wavered after a report by the Conference Board showed that consumer confidence dropped sharply this month. It dropped to 89.4 this month from the previous month's 90.4. This retreat was worse than the expected 90.3. Another report showed that the housing starts and the house price index dropped last month.More numbers released this month showed that the economy is struggling. The economy lost over 23,000 jobs last month, while retail sales dropped modestly during the month.The next important catalyst for the pair will come from the United States, which will release some important metrics. Economists expect the upcoming report to show that the core PCE rose 3.3% in July, while the headline figure rose 3.5% during the month.The PCE report is important because it is the Federal Reserve's preferred inflation gauge. As a result, if it remains stubbornly higher than the Federal Reserve's target of 2.0%, it means that the Fed will maintain a hawkish tone.The EUR/USD pair will also react to the latest US GDP and personal spending reports, which will provide more insights about the US economy.Focus will also be on the upcoming Jackson Hole Symposium, where senior Fed and European Central Bank (ECB) will talk about the economies and what to expect later this year. Economists expect the ECB to hike interest rates in the upcoming meeting in September/USD Technical AnalysisThe daily chart shows that the EUR/USD pair has moved sideways in the past few days. It has remained slightly below this month's high of 1.1710.The pair has remained above the 50-day Exponential Moving Average (EMA). It also moved above the important support level of 1.1621, its highest point on June 15.The pair has formed a bullish flag pattern and is above the Supertrend indicator. Therefore, the pair will likely continue rising as bulls target the key resistance level of 1.1710. A move above that level will point to more gains, potentially to 1.1800.
EURUSD Chart by TradingViewReady to trade our free Forex signals? Here are the top brokers in Europe to choose from.
Legal Disclaimer:
MENAFN provides the
information “as is” without warranty of any kind. We do not accept any
responsibility or liability for the accuracy, content, images, videos,
licenses, completeness, legality, or reliability of the information
contained in this article. If you have any complaints or copyright issues
related to this article, kindly contact the provider above.
Comments
No comment