403
Sorry!!
Error! We're sorry, but the page you were looking for doesn't exist.
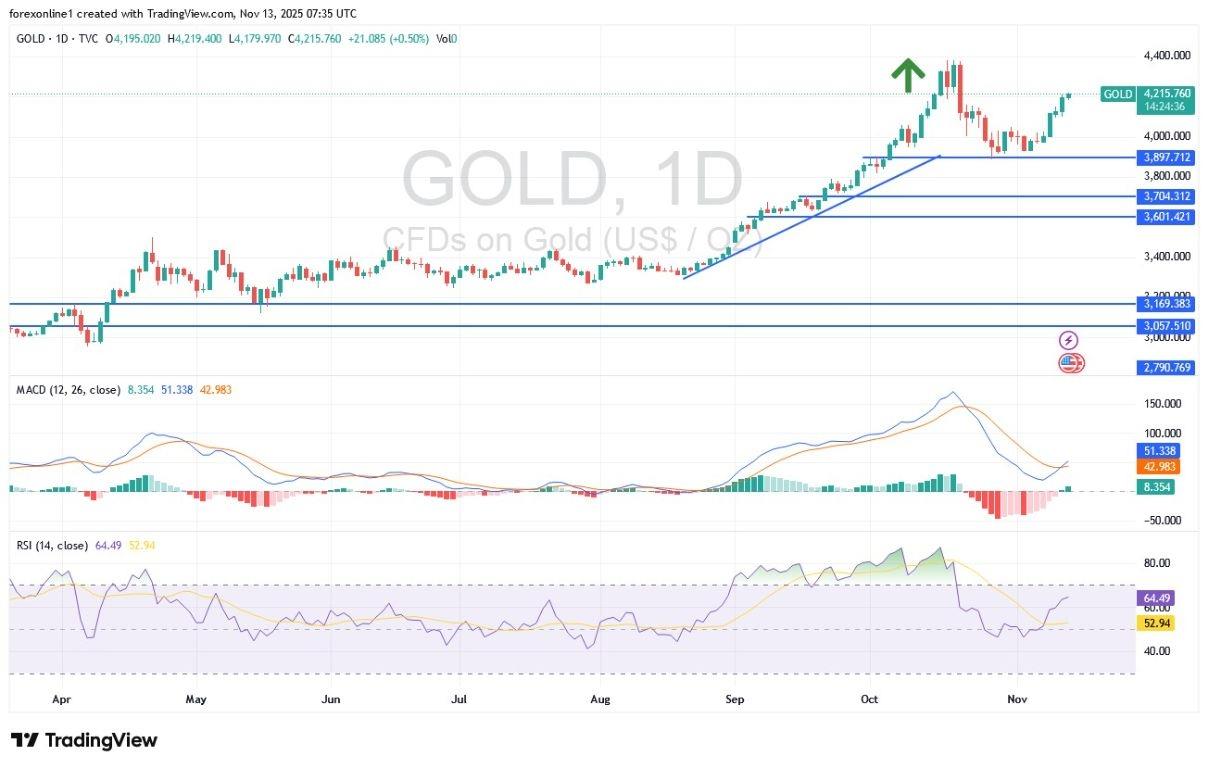
Gold Analysis 13/11: Technical Indicators Overbought (Chart)
(MENAFN- Daily Forex) Today's Gold Analysis Overview:
- The overall of Gold Trend: Strongly Bullish Today's Gold Support Points: $4165 – $4090 – $4000 per ounce. Today's Gold Resistance Points: $4230 – $4280 – $4400 per ounce.
- Sell Gold from the resistance level of $4255 with a target of $3980 and a stop-loss at $4300. Buy Gold from the support level of $4080 with a target of $4250 and a stop-loss at $4020.
A scenario for a decline in gold prices, as seen on the daily chart, requires a drop below $4000 per ounce first.
EURUSD Chart by TradingViewTrading Tips:It's best to wait for a downward technical correction in gold prices before considering buying again, rather than risking buying at the highest levels Market Awaits End of US Government ShutdownThe US government is likely to reopen within 24 hours, which has also boosted metal markets, headed by gold trading. The resumption of US economic data flows may better pave the way for an interest rate cut by the Federal Reserve in December. In this regard, members of the US House of Representatives are returning to Washington D.C. today to vote on ending the 43-day US government shutdown. House Speaker Mike Johnson said he believes the legislation, a difficult compromise hammered out by the Senate and approved by President Trump, will pass quickly. Bloomberg reported: "But he will need to keep his fractured party in line in the face of fierce resistance from House Democrats, who are being urged by their leaders to vote against the legislation."Overall, according to commodity market analysts' forecasts, the fundamental bullish factors still point to further upside risk for the precious metal. Last week, commodity experts at FxPro expressed pessimism about the future of gold, noting that the sharp drop from its record highs last month caused significant technical damage to near-term price action. However, gold forecasts are no longer as negative as they were a week ago. They added that the increasing political uncertainty, driven by the possibility of the Supreme Court overturning tariffs and the Federal Reserve's hawkish stance, creates a favorable atmosphere for gold.Ready to trade today's Gold forecast? Here are the best Gold brokers to choose from.
Legal Disclaimer:
MENAFN provides the
information “as is” without warranty of any kind. We do not accept
any responsibility or liability for the accuracy, content, images,
videos, licenses, completeness, legality, or reliability of the information
contained in this article. If you have any complaints or copyright
issues related to this article, kindly contact the provider above.


Comments
No comment