


Autozone Signal 25/08: How Strong Is The Resistance? (Chart)


(MENAFN- Daily Forex) Short Trade IdeaEnter your short position between 4,094.69 (the lower band of its horizontal resistance zone) and 4,187.39 (the upper band of its horizontal resistance zone).Market Index Analysis
- AutoZone (AZO) is a member of the S&P 500. This index trades near record highs, but bearish factors are dominant. The Bull Bear Power Indicator of the S&P 500 shows a negative divergence.
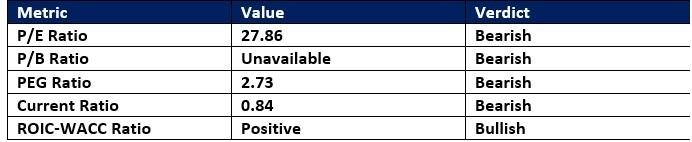
- The AZO D1 chart shows price action inside its horizontal resistance zone. It also shows price action between its ascending 0.0% and 38.2% Fibonacci Retracement Fan levels. The Bull Bear Power Indicator is bullish but shows a negative divergence. The average bearish trading volumes are higher than the average bullish trading volumes. AZO failed to advance with the S&P 500 during the last trading session, a bearish warning signal.
- AZO Entry Level: Between 4,094.69 and 4,187.39 AZO Take Profit: Between 3,632.15 and 3,754.42 AZO Stop Loss: Between 4,250.20 and 4,313.95 Risk/Reward Ratio: 2.97

Legal Disclaimer:
MENAFN provides the
information “as is” without warranty of any kind. We do not accept
any responsibility or liability for the accuracy, content, images,
videos, licenses, completeness, legality, or reliability of the information
contained in this article. If you have any complaints or copyright
issues related to this article, kindly contact the provider above.


Comments
No comment