

US Corporate Training Market 2022-2026: A Descriptive Analysis Of Five Forces Model, Market Dynamics, And Segmentation - Technavio
| US Corporate Training Market Scope | |
| Report Coverage | Details |
| Page number | 120 |
| Base year | 2021 |
| Forecast period | 2022-2026 |
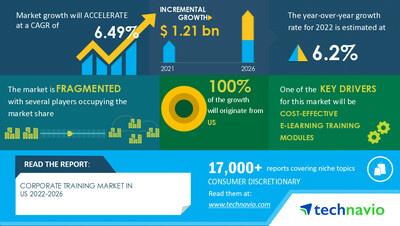
| Growth momentum & CAGR | Accelerate at a CAGR of 6.49% |
| Market growth 2022-2026 | USD 1.21 billion |
| Market structure | Fragmented |
| YoY growth 2021-2022 | 6.2 |
| Competitive landscape | Leading vendors, market positioning of vendors, competitive strategies, and industry risks |
| Key companies profiled | Adobe Inc., Benesse Holdings Inc., Blanchard Training and Development Inc., Cisco Systems Inc., City and Guilds Group, D2L Corp., DEMOS, Development Dimensions International Inc., edX LLC., Franklin Covey Co., Interaction Associates Inc., John Wiley and Sons Inc., Learning Technologies Group Plc, Learning Tree International Inc., Mind Gym Plc, NIIT Ltd, Skillsoft Corp., Stride Inc., Udemy Inc., and Wilson Learning Worldwide Inc. |
| Market dynamics | Parent market analysis, market growth inducers and obstacles, Fast-growing and slow-growing segment analysis, COVID-19 impact and recovery analysis and future consumer dynamics, and market condition analysis for the forecast period. |
| Customization purview | If our report has not included the data that you are looking for, you can reach out to our analysts and get segments customized. |
Browse for Technavio's consumer discretionary market
reports
Table of contents
1 Executive Summary
- 1.1 Market overview
- Exhibit 01: Executive Summary – Chart on Market Overview Exhibit 02: Executive Summary – Data Table on Market Overview Exhibit 03: Executive Summary – Chart on Country Market Characteristics Exhibit 04: Executive Summary – Chart on Market Segmentation by Product Exhibit 05: Executive Summary – Chart on Market Segmentation by End-user Exhibit 06: Executive Summary – Chart on Market Segmentation by Method Exhibit 07: Executive Summary – Chart on Vendor Market Positioning
2 Market Landscape
- 2.1 Market ecosystem
- Exhibit 08: Parent market Exhibit 09: Market Characteristics
3 Market Sizing
- 3.1 Market definition
- Exhibit 10: Offerings of vendors included in the market definition
- 3.2 Market segment analysis
- Exhibit 11: Market segments
- 3.3 Market size 2021
- 3.4 Market outlook: Forecast for 2021-2026
- Exhibit 12: Chart on US - Market size and forecast 2021-2026 ($ million) Exhibit 13: Data Table on US - Market size and forecast 2021-2026 ($ million) Exhibit 14: Chart on US: Year-over-year growth 2021-2026 (%) Exhibit 15: Data Table on US: Year-over-year growth 2021-2026 (%)
4 Five Forces Analysis
- 4.1 Five forces summary
- Exhibit 16: Five forces analysis - Comparison between 2021 and 2026
- 4.2 Bargaining power of buyers
- Exhibit 17: Chart on Bargaining power of buyers – Impact of key factors 2021 and 2026
- 4.3 Bargaining power of suppliers
- Exhibit 18: Bargaining power of suppliers – Impact of key factors in 2021 and 2026
- 4.4 Threat of new entrants
- Exhibit 19: Threat of new entrants – Impact of key factors in 2021 and 2026
- 4.5 Threat of substitutes
- Exhibit 20: Threat of substitutes – Impact of key factors in 2021 and 2026
- 4.6 Threat of rivalry
- Exhibit 21: Threat of rivalry – Impact of key factors in 2021 and 2026
- 4.7 Market condition
- Exhibit 22: Chart on Market condition - Five forces 2021 and 2026
5 Market Segmentation by Product
- 5.1 Market segments
- Exhibit 23: Chart on Product - Market share 2021-2026 (%) Exhibit 24: Data Table on Product - Market share 2021-2026 (%)
- 5.2 Comparison by Product
- Exhibit 25: Chart on Comparison by Product Exhibit 26: Data Table on Comparison by Product
- 5.3 Technical courses - Market size and forecast 2021-2026
- Exhibit 27: Chart on Technical courses - Market size and forecast 2021-2026 ($ million) Exhibit 28: Data Table on Technical courses - Market size and forecast 2021-2026 ($ million) Exhibit 29: Chart on Technical courses - Year-over-year growth 2021-2026 (%) Exhibit 30: Data Table on Technical courses - Year-over-year growth 2021-2026 (%)
- 5.4 Non-technical courses - Market size and forecast 2021-2026
- Exhibit 31: Chart on Non-technical courses - Market size and forecast 2021-2026 ($ million) Exhibit 32: Data Table on Non-technical courses - Market size and forecast 2021-2026 ($ million) Exhibit 33: Chart on Non-technical courses - Year-over-year growth 2021-2026 (%) Exhibit 34: Data Table on Non-technical courses - Year-over-year growth 2021-2026 (%)
- 5.5 Market opportunity by Product
- Exhibit 35: Market opportunity by Product ($ million)
6 Market Segmentation by End-user
- 6.1 Market segments
- Exhibit 36: Chart on End-user - Market share 2021-2026 (%) Exhibit 37: Data Table on End-user - Market share 2021-2026 (%)
- 6.2 Comparison by End-user
- Exhibit 38: Chart on Comparison by End-user Exhibit 39: Data Table on Comparison by End-user
- 6.3 Manufacturing - Market size and forecast 2021-2026
- Exhibit 40: Chart on Manufacturing - Market size and forecast 2021-2026 ($ million) Exhibit 41: Data Table on Manufacturing - Market size and forecast 2021-2026 ($ million) Exhibit 42: Chart on Manufacturing - Year-over-year growth 2021-2026 (%) Exhibit 43: Data Table on Manufacturing - Year-over-year growth 2021-2026 (%)
- 6.4 Healthcare - Market size and forecast 2021-2026
- Exhibit 44: Chart on Healthcare - Market size and forecast 2021-2026 ($ million) Exhibit 45: Data Table on Healthcare - Market size and forecast 2021-2026 ($ million) Exhibit 46: Chart on Healthcare - Year-over-year growth 2021-2026 (%) Exhibit 47: Data Table on Healthcare - Year-over-year growth 2021-2026 (%)
- 6.5 BFSI - Market size and forecast 2021-2026
- Exhibit 48: Chart on BFSI - Market size and forecast 2021-2026 ($ million) Exhibit 49: Data Table on BFSI - Market size and forecast 2021-2026 ($ million) Exhibit 50: Chart on BFSI - Year-over-year growth 2021-2026 (%) Exhibit 51: Data Table on BFSI - Year-over-year growth 2021-2026 (%)
- 6.6 IT - Market size and forecast 2021-2026
- Exhibit 52: Chart on IT - Market size and forecast 2021-2026 ($ million) Exhibit 53: Data Table on IT - Market size and forecast 2021-2026 ($ million) Exhibit 54: Chart on IT - Year-over-year growth 2021-2026 (%) Exhibit 55: Data Table on IT - Year-over-year growth 2021-2026 (%)
- 6.7 Others - Market size and forecast 2021-2026
- Exhibit 56: Chart on Others - Market size and forecast 2021-2026 ($ million) Exhibit 57: Data Table on Others - Market size and forecast 2021-2026 ($ million) Exhibit 58: Chart on Others - Year-over-year growth 2021-2026 (%) Exhibit 59: Data Table on Others - Year-over-year growth 2021-2026 (%)
- 6.8 Market opportunity by End-user
- Exhibit 60: Market opportunity by End-user ($ million)
7 Market Segmentation by Method
- 7.1 Market segments
- Exhibit 61: Chart on Method - Market share 2021-2026 (%) Exhibit 62: Data Table on Method - Market share 2021-2026 (%)
- 7.2 Comparison by Method
- Exhibit 63: Chart on Comparison by Method Exhibit 64: Data Table on Comparison by Method
- 7.3 Blended Learning - Market size and forecast 2021-2026
- Exhibit 65: Chart on Blended Learning - Market size and forecast 2021-2026 ($ million) Exhibit 66: Data Table on Blended Learning - Market size and forecast 2021-2026 ($ million) Exhibit 67: Chart on Blended Learning - Year-over-year growth 2021-2026 (%) Exhibit 68: Data Table on Blended Learning - Year-over-year growth 2021-2026 (%)
- 7.4 Offline learning - Market size and forecast 2021-2026
- Exhibit 69: Chart on Offline learning - Market size and forecast 2021-2026 ($ million) Exhibit 70: Data Table on Offline learning - Market size and forecast 2021-2026 ($ million) Exhibit 71: Chart on Offline learning - Year-over-year growth 2021-2026 (%) Exhibit 72: Data Table on Offline learning - Year-over-year growth 2021-2026 (%)
- 7.5 Online learning - Market size and forecast 2021-2026
- Exhibit 73: Chart on Online learning - Market size and forecast 2021-2026 ($ million) Exhibit 74: Data Table on Online learning - Market size and forecast 2021-2026 ($ million) Exhibit 75: Chart on Online learning - Year-over-year growth 2021-2026 (%) Exhibit 76: Data Table on Online learning - Year-over-year growth 2021-2026 (%)
- 7.6 Market opportunity by Method
- Exhibit 77: Market opportunity by Method ($ million)
8 Customer Landscape
- 8.1 Customer landscape overview
- Exhibit 78: Analysis of price sensitivity, lifecycle, customer purchase basket, adoption rates, and purchase criteria
9 Drivers, Challenges, and Trends
- 9.1 Market drivers
- 9.2 Market challenges
- 9.3 Impact of drivers and challenges
- Exhibit 79: Impact of drivers and challenges in 2021 and 2026
- 9.4 Market trends
10 Vendor Landscape
- 10.1 Overview
- 10.2 Vendor landscape
- Exhibit 80: Overview on Criticality of inputs and Factors of differentiation
- 10.3 Landscape disruption
- Exhibit 81: Overview on factors of disruption
- 10.4 Industry risks
- Exhibit 82: Impact of key risks on business
11 Vendor Analysis
- 11.1 Vendors covered
- Exhibit 83: Vendors covered
- 11.2 Market positioning of vendors
- Exhibit 84: Matrix on vendor position and classification
- 11.3 Adobe Inc.
- Exhibit 85: Adobe Inc. - Overview Exhibit 86: Adobe Inc. - Business segments Exhibit 87: Adobe Inc. - Key news Exhibit 88: Adobe Inc. - Key offerings Exhibit 89: Adobe Inc. - Segment focus
- 11.4 Cisco Systems Inc.
- Exhibit 90: Cisco Systems Inc. - Overview Exhibit 91: Cisco Systems Inc. - Business segments Exhibit 92: Cisco Systems Inc. - Key news Exhibit 93: Cisco Systems Inc. - Key offerings Exhibit 94: Cisco Systems Inc. - Segment focus
- 11.5 City and Guilds Group
- Exhibit 95: City and Guilds Group - Overview Exhibit 96: City and Guilds Group - Product / Service Exhibit 97: City and Guilds Group - Key offerings
- 11.6 D2L Corp.
- Exhibit 98: D2L Corp. - Overview Exhibit 99: D2L Corp. - Product / Service Exhibit 100: D2L Corp. - Key news Exhibit 101: D2L Corp. - Key offerings
- 11.7 Franklin Covey Co.
- Exhibit 102: Franklin Covey Co. - Overview Exhibit 103: Franklin Covey Co. - Business segments Exhibit 104: Franklin Covey Co. - Key offerings Exhibit 105: Franklin Covey Co. - Segment focus
- 11.8 John Wiley and Sons Inc.
- Exhibit 106: John Wiley and Sons Inc. - Overview Exhibit 107: John Wiley and Sons Inc. - Business segments Exhibit 108: John Wiley and Sons Inc. - Key offerings Exhibit 109: John Wiley and Sons Inc. - Segment focus
- 11.9 Learning Technologies Group Plc
- Exhibit 110: Learning Technologies Group Plc - Overview Exhibit 111: Learning Technologies Group Plc - Business segments Exhibit 112: Learning Technologies Group Plc - Key news Exhibit 113: Learning Technologies Group Plc - Key offerings Exhibit 114: Learning Technologies Group Plc - Segment focus
- 11.10 NIIT Ltd
- Exhibit 115: NIIT Ltd - Overview Exhibit 116: NIIT Ltd - Product / Service Exhibit 117: NIIT Ltd - Key news Exhibit 118: NIIT Ltd - Key offerings
- 11.11 Skillsoft Corp.
- Exhibit 119: Skillsoft Corp. - Overview Exhibit 120: Skillsoft Corp. - Business segments Exhibit 121: Skillsoft Corp. - Key offerings Exhibit 122: Skillsoft Corp. - Segment focus
- 11.12 Wilson Learning Worldwide Inc.
- Exhibit 123: Wilson Learning Worldwide Inc. - Overview Exhibit 124: Wilson Learning Worldwide Inc. - Business segments Exhibit 125: Wilson Learning Worldwide Inc. - Key offerings Exhibit 126: Wilson Learning Worldwide Inc. - Segment focus
12 Appendix
- 12.1 Scope of the report
- 12.2 Inclusions and exclusions checklist
- Exhibit 127: Inclusions checklist Exhibit 128: Exclusions checklist
- 12.3 Currency conversion rates for US$
- Exhibit 129: Currency conversion rates for US$
- 12.4 Research methodology
- Exhibit 130: Research methodology Exhibit 131: Validation techniques employed for market sizing Exhibit 132: Information sources
- 12.5 List of abbreviations
- Exhibit 133: List of abbreviations
Technavio is a leading global technology research and advisory company. Their research and analysis focus on emerging market trends and provide actionable insights to help businesses identify market opportunities and develop effective strategies to optimize their market positions. With over 500 specialized analysts, Technavio's report library consists of more than 17,000 reports and counting, covering 800 technologies, spanning across 50 countries. Their client base consists of enterprises of all sizes, including more than 100 Fortune 500 companies. This growing client base relies on Technavio's comprehensive coverage, extensive research, and actionable market insights to identify opportunities in existing and potential markets and assess their competitive positions within changing market scenarios.
Contact
Technavio Research
Jesse Maida
Media & Marketing Executive
US: +1 844 364 1100
UK: +44 203 893 3200
Email: [email protected]
Website:
SOURCE Technavio

Legal Disclaimer:
MENAFN provides the
information “as is” without warranty of any kind. We do not accept
any responsibility or liability for the accuracy, content, images,
videos, licenses, completeness, legality, or reliability of the information
contained in this article. If you have any complaints or copyright
issues related to this article, kindly contact the provider above.
Most popular stories
Market Research

- Origin Summit Unveils Second Wave Of Global Icons Ahead Of Debut During KBW
- Dupoin Reports Global Growth, Regulatory Coverage, And User Experience Insights
- Jpmorgan Product Head Joins GSR Trading MD To Build Institutional Staking Markets
- Betfury Is At SBC Summit Lisbon 2025: Affiliate Growth In Focus
- Hola Prime Expands Its Platform Ecosystem With Next-Gen Tradelocker
- Zebu Live 2025 Welcomes Coinbase, Solana, And Other Leaders Together For UK's Biggest Web3 Summit
More Story


Comments
No comment