


Trading Reversals with the Harami Candlestick


 Harami Candlestick and Reversal Patterns: Main Talking PointsReversal patterns are very popular in technical trading which can allow traders to capitalise on changes in market trends The Harami candlestick is highly recognisable and can catch a reversal pattern at the most opportune time with tight risk. In this way, Harami reversals can help traders to identify a clear bias and risk points. One of the most used reversal candle patterns is known as theHarami . Like most candlestick formation patterns, the Harami tells a story about real time sentiment in the market. After the pattern is composed with the closing of the signal candle, then you can look to the following candle to identify a clear bias and risk points.
 In this article we explore the Harami candlestick and reversal patterns in depth, and how to apply this knowledge to atrading strategy .
Why do traders look out for reversal patterns? Candlestick trading signals are usually divided intoreversal patternsorcontinuation patterns . Continuation patterns can help traders see when thesentimentis likely to keep the prevailing trend going strong.Reversal patterns help traders recognize when the sentiment that was behind a trend potentially ceases as the pair flips its direction. The formation of the candles contains the information from buyers and sellers that indicate these potential reversals. Understanding and being able to notice reversal candlestick patterns like the Harami is beneficial for traders in taking advantage of changes in trend.
Using the Harami Candlestick to Catch Reversals The popularity of the Harami candlestick pattern is due to how it allows traders to catch a reversal at the most opportune time with tight risk. This can lead to very favorablerisk-reward ratios . In order to use the Harami to spot reversal patterns, it's important for traders to understand the origin of the candlestick and how it can be used with other technical tools.Supporting functions of the Harami
When studying candlestick trading to pinpoint market turning points, traders are quickly introduced to theDoji candlestick . The most common principle and first lesson relates to the appearance of the Doji candlestick, which can often represent apending reversal and an opportune time to enter into a trade.Although Dojis are only composed of one candle that open and closes at near the same level, and an upper and lower wick out of the body like a '+' sign; the next candle tells the story as to the trade preference you should have.
Once a Doji forms, it's important to note that using other oscillating indicators or moving averages to find if the pair is in an extreme condition or not. This identifies when candlestick formations are most potent.The Harami is named because it has the appearance of a 'pregnant woman'. The first candle is a large candle continuing the immediate trend and the Doji is a small candle protruding like a pregnant woman. The second candle will tell us if the Doji gives life to a reversal or follows thetrendwith the starting candle.
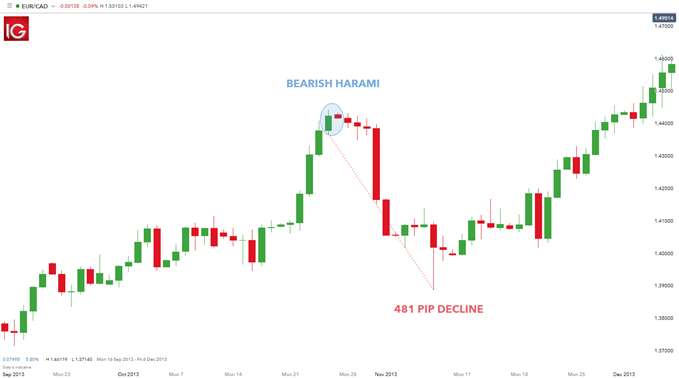 Harami candlestick reversal pattern example
 The chart above shows a Bearish Harami in action on theEUR/CADcurrency pair. The daily graph has been in a long-standing established uptrend, but prices have a tendency to retrace along the way. This last retracement was started with the formation of a Harami. With its creation, the market put in its current high then quickly descended 481pips .
Traders looking to take advantage of the Bearish Harami pattern can add it into any existing trendtrading plan . Traders can look to take profits on any existing long trades, or even consider trading a full out reversal once this pattern appears. Regardless of the trading plan, when adding new components to a strategy traders should be tracking results with atrade journal . This way over time traders can gauge the effectiveness of price action and candle analysis in trading.Read more on Harami Candlesticks and Reversal TradingLearn more about theHarami candlestickand how it's formed. Reading a candlestick chartis an important foundation to have before analyzing more complex techniques such as Harami and Doji candlesticks. Spot extreme conditions or trend support / resistance, with an introduction tofour highly effective indicators that every trader should know Use indicators to increase theeffectiveness of candlestick entries

Legal Disclaimer:
MENAFN provides the
information “as is” without warranty of any kind. We do not accept any
responsibility or liability for the accuracy, content, images, videos,
licenses, completeness, legality, or reliability of the information
contained in this article. If you have any complaints or copyright issues
related to this article, kindly contact the provider above.
Comments
No comment