Gold Price Outlook: XAU/USD Breakout to Intensify as Volatility Surges
Gold Daily Price Chart Technical Outlook: In our latest our ‘bottom line' noted that price had, 'cleared a technical resistance confluence / the monthly opening-range high and keeps the outlook weighted to the topside… From a trading standpoint, I'll continue to favor fading weakness while above this week's open at 1203 targeting the 1235/38 resistance range. The registered a high at 1233 this week before turning lower with gold unable to close above the 100-day moving average for the past four sessions. Key near-term support rests at 1214/15 pivot zone with the outlook weighted to the topside while above the objective monthly high at 1208.
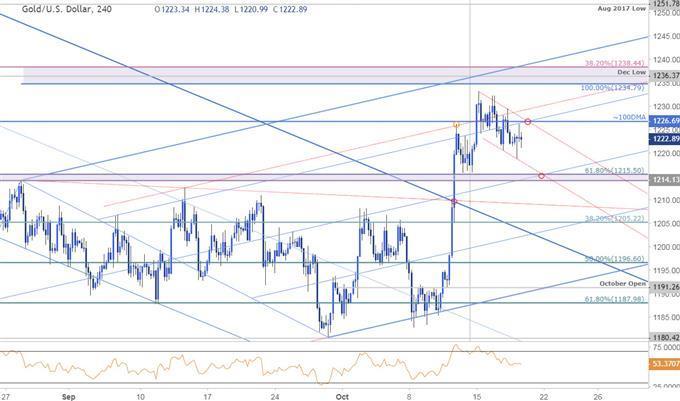
New to Gold Trading? Get started with thisGold 240min Price Chart Notes: A closer look at price action shows gold continuing to trade within the confines of the ascending pitchfork formation highlighted in last week's . The advance took out two of our targets before turning with the pullback taking the shape of a possible bull-flag formation. A breach above the resistance confluence around 1227 is needed to fuel a push into the 1235/38 resistance target- expect a more significant reaction there.
A break below 1214 would risk a larger decline with such a scenario targeting former slope resistance (red) around ~1208 and the 25% line / 38.2% retracement at 1205 both levels of interest for possible exhaustion / long-entries if reached. Ultimately a rally surpassing would be needed to mark resumption of the breakout with subsequent topside objectives eyed at the August low at 1251 and the October 2017 low / 50% retracement at 1261/63.Why does the average trader lose?
Bottom line: The immediate focus for gold is on a break of the 1214-1239 price range for guidance from a trading standpoint, I'll continue to favor fading weakness in price targeting a breach of this key resistance zone. For now, If you're not already long, looking for either a drop into 1214/15 OR a breach & re-test of 1238 to offer possible entries.For a complete breakdown of Michael's trading strategy, review his
Gold Trader Sentiment A summary of shows traders are net-long Gold - the ratio stands at +4.47(81.7% of traders are long) bearishreading Long positions are0.5% higher than yesterday and 8.5% lower from last week Short positions are 3.1% higher than yesterday and 54.1% higher from last week We typically take a contrarian view to crowd sentiment, and the fact traders are net-long suggests Spot Gold prices may continue to fall. Yet traders are less net-long than yesterday and compared with last week and the recent changes in sentiment warn that the current Gold price trend may soon reverse higher despite the fact traders remain net-long. See how shifts in Gold retail positioning are impacting trend----
- latest economic developments and upcoming event risk. Learn more about how we !Active Trade Setups - Written by , Currency Strategist with DailyFX
Follow Michael on Twitter or contact him at

Legal Disclaimer:
MENAFN provides the
information “as is” without warranty of any kind. We do not accept
any responsibility or liability for the accuracy, content, images,
videos, licenses, completeness, legality, or reliability of the information
contained in this article. If you have any complaints or copyright
issues related to this article, kindly contact the provider above.


Comments
No comment