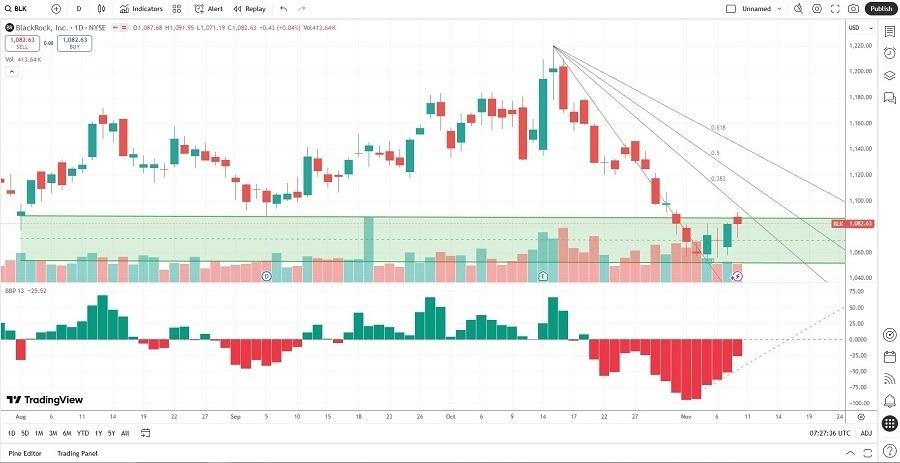
(MENAFN- Daily Forex) Long Trade IdeaEnter your long position between $1,053.63 (the lower band of its horizontal support zone) and $1,088.57 (the upper band of its horizontal support zone).Top Forex Brokers1 Get Started 74% of retail CFD accounts lose money Market Index Analysis BlackRock (BLK) is a member of the S&P 100 and the S&P 500 Index. Both indices remain near all-time highs, but bearish factors are accumulating. The Bull Bear Power Indicator of the S&P 500 turned bullish with a descending trendline.
Market Sentiment AnalysisEquity markets rallied yesterday, building on Friday's midday reversal. AI-related stocks led gains, recovering from last week's heavy selling amid valuation concerns. The likely end of the government shutdown boosted sentiment after the Senate passed a bill to reopen it. Despite the risk-on sentiment, gold rallied amid President Trump's tariff rebate proposal, which could amount to up to $2,000 per qualifying person in the form of tax breaks, and amid associated inflationary pressures. While AI darlings led the rally, earnings from Taiwan Semiconductor Manufacturing and CoreWeave show cracks in the bull case Fundamental AnalysisBlackRock is a multinational investment company, the world's largest asset manager with over $13.5 trillion in assets under management, and one of the Big Four index fund managers, managing the iShares ETF group.So, why am I bullish on BLK following its 12%+ correction?BlackRock continues to position itself at the forefront of economic growth. The latest examples are deals with the Al Tamimi & Company for a 49% stake in the Jafurah gas processing facilities in Saudi Arabia from Aramco, and the $40 billion acquisition of Aligned Data Centers via a consortium. I am bullish about its Aladdin software and the ongoing demand for ETFs, which positions BlackRock for more upside.
| Metric | Value | Verdict |
| PE Ratio | 27.85 | Bullish |
| PB Ratio | 3.03 | Bearish |
| PEG Ratio | 1.96 | Bullish |
| Current Ratio | 2.57 | Bullish |
| ROIC-WACC Ratio | Positive | Bullish BlackRock Fundamental Analysis SnapshotThe price-to-earnings (PE) ratio of 27.85 indicates BLK is fairly valued. By comparison, the P/E ratio for the S&P 500 Index is 30.60.The average analyst price target for BLK is $1,334.47. It suggests excellent upside potential with acceptable downside risk Technical AnalysisToday's BLK Signal The BLK D1 chart shows price action trying to break out above its horizontal support zone. It also shows price action between its descending 0.0% and 38.2% Fibonacci Retracement Fan levels. The Bull Bear Power Indicator is bearish with an ascending support line, approaching a bullish crossover. The average bearish trading volumes have risen but suggest downside exhaustion. BLK corrected while the S&P 500 Index hovers near record highs, a bearish confirmation, but bullish indicators are rising. AdvertisementMy Call on BlackRockI am taking a long position in BLK between $1,053.63 and $1,088.57. As a Big Four index fund manager, I remain bullish about the iShares ETF group managed by BlackRock. The expanding presence in data centers, natural gas, and asset management software should drive a price action reversal by the end of the year. BLK Entry Level: Between $1,053.63 and $1,088.57 BLK Take Profit: Between $1,219.94 and $1,280.94 BLK Stop Loss: Between $980.20 and $1,003.31 Risk/Reward Ratio: 2.27 Ready to trade our analysis of BlackRock? Here is our list of the top stock brokers worth checking out. |
MENAFN11112025000131011023ID1110328569
Legal Disclaimer:
MENAFN provides the
information “as is” without warranty of any kind. We do not accept
any responsibility or liability for the accuracy, content, images,
videos, licenses, completeness, legality, or reliability of the information
contained in this article. If you have any complaints or copyright
issues related to this article, kindly contact the provider above.


Comments
No comment