403
Sorry!!
Error! We're sorry, but the page you were looking for doesn't exist.
BTC/USD Forex Signal 11/11: Rally Losing Steam (Chart)
(MENAFN- Daily Forex) Bearish view
- Sell the BTC/USD pair and set a take-profit at 100,000. Add a stop-loss at 109,000. Timeline: 1-2 days.
- Buy the BTC/USD pair and set a take-profit at 109,000. Add a stop-loss at 100,000.
The BTC/USD pair is also reacting to a suggestion by Donald Trump that he may use part of the tariff revenue to send a $2,000 stimulus check. Some of these funds will flow to the crypto market as it happened during the pandemic.
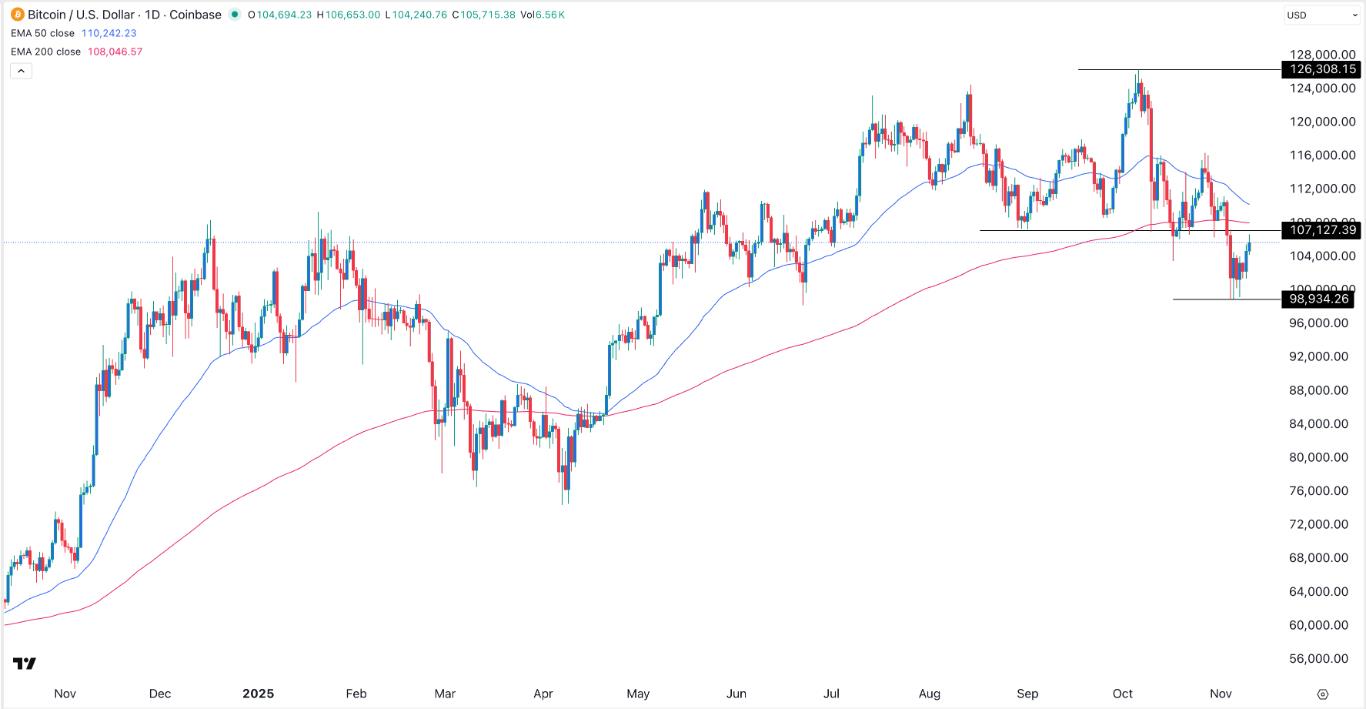
EURUSD Chart by TradingViewBTC/USD Technical AnalysisThe daily timeframe chart shows that the BTC/USD pair has remained under pressure in the past few months, moving from a high of 126,300 in October to a low of 98,935. It has now attempted to rebound but has faced substantial rejection at 106,000.The pair is about to form a death cross pattern as the 50-day and 200-day Exponential Moving Averages (EMA) are about to cross each other. This pattern often leads to more downside.It is also attempting to retest the important resistance level at 107,127, the lowest point on August 31 this year, and the neckline of the double-top pattern.Therefore, the most likely scenario is where it resumes the downtrend and initially retests the support level at 100,000.Ready to trade our free Forex signals? Here are the best MT4 crypto brokers to choose from.
Legal Disclaimer:
MENAFN provides the
information “as is” without warranty of any kind. We do not accept
any responsibility or liability for the accuracy, content, images,
videos, licenses, completeness, legality, or reliability of the information
contained in this article. If you have any complaints or copyright
issues related to this article, kindly contact the provider above.


Comments
No comment