(MENAFN- PR Newswire) NEW YORK, Jan. 17, 2023 /PRNewswire/ --
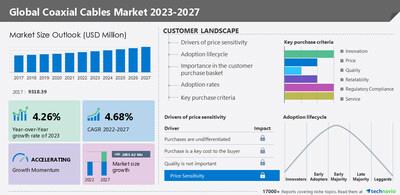
According to Technavio, the global coaxial cables market size is estimated to grow by USD 2,855.62 million from 2022 to 2027. The market is estimated to grow at a CAGR of 4.68% during the forecast period. APAC held the largest share of the global market in 2022, and the market in the region is estimated to witness an incremental growth of 44%. For more Insights on market size , request a sample report
Coaxial cables market - Five Forces
The global cloud data warehouse market is fragmented, and the five forces analysis covers–
continue reading
Technavio has announced its latest market research report titled Global Coaxial Cables Market 2023-2027
Bargaining Power of Buyers
The threat of New Entrants Threat of Rivalry Bargaining Power of Suppliers Threat of Substitutes Interpretation of porter's five models helps to strategize the business, for entire details – buy the report!
Coaxial cables market – Customer Landscape
The report includes the market's adoption lifecycle, from the innovator's stage to the laggard's stage. It focuses on adoption rates in different regions based on penetration. Furthermore, the report also includes key purchase criteria and drivers of price sensitivity to help companies evaluate and develop their growth strategies.
Coaxial cables market - Segmentation Assessment
Segment Overview
Technavio has segmented the market based on end-user (telecommunication, transportation and military, CATV providers, and others), application (video distribution, internet data transfer, and radio frequency transfer), and geography (APAC, Europe, North America, Middle East and Africa, and South America).
The market share growth by the telecommunication segment will be significant during the forecast period. The growth in the number of consumers using mobile and wireless devices and the development of next-generation technologies have increased the demand for telecommunication services. Hence, telecom operators are investing heavily in expanding the reach of their networks across all geographic areas. This is increasing the demand for coaxial cables in the telecommunications industry.
Geography Overview
By geography, the global coaxial cables market is segmented into APAC, Europe, North America, Middle East and Africa, and South America. The report provides actionable insights and estimates the contribution of all regions to the growth of the global coaxial cables market.
APAC will account for
44% of the market's growth during the forecast period. The growth of the regional market can be attributed to factors such as the digitization of CATV networks, the growth of mobile telecommunication networks, and the replacement of slow DSL Internet with high-speed cable networks.
download a sample report
Coaxial cables market – Market Dynamics
Key factor driving market growth
The market is driven by the digitization of television networks in developing countries. Developing countries across the world are introducing initiatives to encourage the digitization of TV networks. This is leading to the phasing out of analog services. For instance, China has implemented the Next Generation Broadband Initiative (NGB). The implementation of NGB will be followed by a gradual shutdown of analog services across the country. This will give the subscribers access to high-definition multimedia content and two-way transmission of data over a single coaxial cable network. Similarly, in 2012, the Government of India passed a mandate which forced cable operators to use set-top boxes at consumer premises. The move enabled high-quality content delivery to the subscribers while reducing the cost of cable service and allowing broadcasters to monitor content consumption patterns. Such developments are creating huge growth opportunities for vendors operating in the market.
Leading trends influencing the market
One of the key trends identified in the market is the regulations on the development of cable TV infrastructure. Governments across the world are introducing various regulations to improve transparency and provide more options to consumers. For instance, in 2018, the Conference of Belgian Telecom Regulators introduced a new fiber access regulation for the retail broadband and broadcasting market in Belgium. The new regulation was aimed at increasing the customer base of cable TV by offering a large number of choices at reduced prices. Similarly, in 2018, the Telecom Regulatory Authority of India (TRAI) introduced a new tariff regime for broadcasters. The new tariff regime was focused on improving the transparency between Pay-TV operators and broadcasters. The introduction of such regulations has been crucial in expanding the consumer base of cable TV, which is driving the growth of the market.
Major challenges hindering market growth
Increasing competition from wireless and fiber optic standards is the key challenge in the market. Conventional TV networks have their entire systems connected by coaxial cables. These cables have certain limitations in carrying data. The theoretical limit for at-home coaxial cable is 10 Gbps. With ever-increasing data loads, users are switching to either fiber or wireless mediums as they provide higher utility at lower costs. This is leading to the replacement of traditional TV networks with hybrid fiber-coaxial (HFC), all-optical fiber to the home (FTTH), and, more recently, optical-wireless hybrid systems. This will reduce the growth potential in the market.
driver, trend, and challenges are the factors of market dynamics that state about consequences & sustainability of the businesses, find some insights from a sample report!
What are the key data covered in this coaxial cables market report?
CAGR of the market during the forecast period Detailed information on factors that will drive the growth of the coaxial cables market between 2023 and 2027 Precise estimation of the size of the coaxial cables market size and its contribution to the market in focus on the parent market Accurate predictions about upcoming trends and changes in consumer behavior Growth of the coaxial cables market industry across APAC, Europe, North America, Middle East and Africa, and South America A thorough analysis of the market's competitive landscape and detailed information about vendors Comprehensive analysis of factors that will challenge the growth of coaxial cables market vendors
Gain instant access to 17,000+ market research reports.
technavio's subscription platform
Related Reports:
The cables and accessories market is estimated to grow at a CAGR of 5.46% between 2022 and 2027. The size of the market is forecast to increase by USD 43.66 billion. The rising adoption of smart grid technology is notably driving the market growth, although factors such as the volatility in raw material prices may impede the market growth. The submarine fiber cable market is estimated to grow at a CAGR of 12.2% between 2022 and 2027. The size of the market is forecast to increase by USD 4852.77 million. The rapid developments in telecommunication networks are notably driving the market growth, although factors such as the fiber damage caused by human activities and fish attacks may impede the market growth.
| Coaxial Cables Market Scope |
| Report Coverage | Details |
| Page number | 178 |
| Base year | 2022 |
| Historic period | 2017-2021 |
| Forecast period | 2023-2027 |
| Growth momentum & CAGR | Accelerate at a CAGR of 4.68% |
| Market growth 2023-2027 | USD 2855.62 million |
| Market structure | Fragmented |
| YoY growth 2022-2023
(%) | 4.26 |
| Regional analysis | APAC, Europe, North America, Middle East and Africa, and South America |
| Performing market contribution | APAC at 44% |
| Key countries | US, China, Japan, South Korea, and Germany |
| Competitive landscape | Leading Vendors, Market Positioning of Vendors, Competitive Strategies, and Industry Risks |
| Key companies profiled | Alpha Wire Inc., Amphenol Corp., Belden Inc., Coleman Wires and Cables, CommScope Holding Co. Inc., Habia Cable AB, Hengxin Technology Ltd., HUBER SUHNER AG, Infinite Electronics Inc., Infinite Electronics International Inc., Kingsignal Technology Co. Ltd., Leoni AG, LS Cable and System Ltd., Prysmian Spa, Southwire Co. LLC, Sumitomo Electric Industries Ltd., TE Connectivity Ltd., Trigiant Group Ltd., W. L. Gore and Associates Inc., and Zhuhai Hansen Technology Co. Ltd. |
| Market dynamics | Parent market analysis, market growth inducers and obstacles, fast-growing and slow-growing segment analysis, COVID-19 impact and recovery analysis and future consumer dynamics, and market condition analysis for the forecast period. |
| Customization purview | If our report has not included the data that you are looking for, you can reach out to our analysts and get segments customized. |
| Customization purview | If our report has not included the data that you are looking for, you can reach out to our analysts and get segments customized. |
Table of contents:
1 Executive Summary
1.1 Market overview
Exhibit 01: Executive Summary – Chart on Market Overview Exhibit 02: Executive Summary – Data Table on Market Overview Exhibit 03: Executive Summary – Chart on Global Market Characteristics Exhibit 04: Executive Summary – Chart on Market by Geography Exhibit 05: Executive Summary – Chart on Market Segmentation by End-user Exhibit 06: Executive Summary – Chart on Market Segmentation by Application Exhibit 07: Executive Summary – Chart on Incremental Growth Exhibit 08: Executive Summary – Data Table on Incremental Growth Exhibit 09: Executive Summary – Chart on Vendor Market Positioning
2 Market Landscape
2.1 Market ecosystem
Exhibit 10: Parent market Exhibit 11: Market Characteristics
3 Market Sizing
3.1 Market definition
Exhibit 12: Offerings of vendors included in the market definition
3.2 Market segment analysis
Exhibit 13: Market segments
3.4 Market outlook: Forecast for 2022-2027
Exhibit 14: Chart on Global - Market size and forecast 2022-2027 ($ million) Exhibit 15: Data Table on Global - Market size and forecast 2022-2027 ($ million) Exhibit 16: Chart on Global Market: Year-over-year growth 2022-2027 (%) Exhibit 17: Data Table on Global Market: Year-over-year growth 2022-2027 (%)
4 Historic Market Size
4.1 Global coaxial cables market 2017 - 2021 Exhibit 18: Historic Market Size – Data Table on Global coaxial cables market 2017 - 2021 ($ million)
4.2 End-user Segment Analysis 2017 - 2021
Exhibit 19: Historic Market Size – End-user Segment 2017 - 2021 ($ million)
4.3 Application Segment Analysis 2017 - 2021 Exhibit 20: Historic Market Size – Application Segment 2017 - 2021 ($ million)
4.4 Geography Segment Analysis 2017 - 2021
Exhibit 21: Historic Market Size – Geography Segment 2017 - 2021 ($ million)
4.5 Country Segment Analysis 2017 - 2021
Exhibit 22: Historic Market Size – Country Segment 2017 - 2021 ($ million)
5 Five Forces Analysis
5.1 Five forces summary
Exhibit 23: Five forces analysis - Comparison between 2022 and 2027
5.2 Bargaining power of buyers
Exhibit 24: Chart on Bargaining power of buyers – Impact of key factors 2022 and 2027
5.3 Bargaining power of suppliers
Exhibit 25: Bargaining power of suppliers – Impact of key factors in 2022 and 2027
5.4 Threat of new entrants
Exhibit 26: Threat of new entrants – Impact of key factors in 2022 and 2027
5.5 Threat of substitutes
Exhibit 27: Threat of substitutes – Impact of key factors in 2022 and 2027
5.6 Threat of rivalry
Exhibit 28: Threat of rivalry – Impact of key factors in 2022 and 2027
5.7 Market condition
Exhibit 29: Chart on Market condition - Five forces 2022 and 2027
6 Market Segmentation by End-user
6.1 Market segments
Exhibit 30: Chart on End-user - Market share 2022-2027 (%) Exhibit 31: Data Table on End-user - Market share 2022-2027 (%)
6.2 Comparison by End-user
Exhibit 32: Chart on Comparison by End-user Exhibit 33: Data Table on Comparison by End-user
6.3 Telecommunication - Market size and forecast 2022-2027 Exhibit 34: Chart on Telecommunication - Market size and forecast 2022-2027 ($ million) Exhibit 35: Data Table on Telecommunication - Market size and forecast 2022-2027 ($ million) Exhibit 36: Chart on Telecommunication - Year-over-year growth 2022-2027 (%) Exhibit 37: Data Table on Telecommunication - Year-over-year growth 2022-2027 (%)
6.4 Transportation and military - Market size and forecast 2022-2027
Exhibit 38: Chart on Transportation and military - Market size and forecast 2022-2027 ($ million) Exhibit 39: Data Table on Transportation and military - Market size and forecast 2022-2027 ($ million) Exhibit 40: Chart on Transportation and military - Year-over-year growth 2022-2027 (%) Exhibit 41: Data Table on Transportation and military - Year-over-year growth 2022-2027 (%)
6.5 CATV providers - Market size and forecast 2022-2027 Exhibit 42: Chart on CATV providers - Market size and forecast 2022-2027 ($ million) Exhibit 43: Data Table on CATV providers - Market size and forecast 2022-2027 ($ million) Exhibit 44: Chart on CATV providers - Year-over-year growth 2022-2027 (%) Exhibit 45: Data Table on CATV providers - Year-over-year growth 2022-2027 (%)
6.6 Others - Market size and forecast 2022-2027 Exhibit 46: Chart on Others - Market size and forecast 2022-2027 ($ million) Exhibit 47: Data Table on Others - Market size and forecast 2022-2027 ($ million) Exhibit 48: Chart on Others - Year-over-year growth 2022-2027 (%) Exhibit 49: Data Table on Others - Year-over-year growth 2022-2027 (%)
6.7 Market opportunity by End-user
Exhibit 50: Market opportunity by End-user ($ million)
7 Market Segmentation by Application
7.1 Market segments
Exhibit 51: Chart on Application - Market share 2022-2027 (%) Exhibit 52: Data Table on Application - Market share 2022-2027 (%)
7.2 Comparison by Application
Exhibit 53: Chart on Comparison by Application Exhibit 54: Data Table on Comparison by Application
7.3 Video distribution - Market size and forecast 2022-2027 Exhibit 55: Chart on Video distribution - Market size and forecast 2022-2027 ($ million) Exhibit 56: Data Table on Video distribution - Market size and forecast 2022-2027 ($ million) Exhibit 57: Chart on Video distribution - Year-over-year growth 2022-2027 (%) Exhibit 58: Data Table on Video distribution - Year-over-year growth 2022-2027 (%)
7.4 Internet data transfer - Market size and forecast 2022-2027
Exhibit 59: Chart on Internet data transfer - Market size and forecast 2022-2027 ($ million) Exhibit 60: Data Table on Internet data transfer - Market size and forecast 2022-2027 ($ million) Exhibit 61: Chart on Internet data transfer - Year-over-year growth 2022-2027 (%) Exhibit 62: Data Table on Internet data transfer - Year-over-year growth 2022-2027 (%)
7.5 Radio frequency transfer - Market size and forecast 2022-2027
Exhibit 63: Chart on Radio frequency transfer - Market size and forecast 2022-2027 ($ million) Exhibit 64: Data Table on Radio frequency transfer - Market size and forecast 2022-2027 ($ million) Exhibit 65: Chart on Radio frequency transfer - Year-over-year growth 2022-2027 (%) Exhibit 66: Data Table on Radio frequency transfer - Year-over-year growth 2022-2027 (%)
7.6 Market opportunity by Application
Exhibit 67: Market opportunity by Application ($ million)
8 Customer Landscape
8.1 Customer landscape overview
Exhibit 68: Analysis of price sensitivity, lifecycle, customer purchase basket, adoption rates, and purchase criteria
9 Geographic Landscape
9.1 Geographic segmentation
Exhibit 69: Chart on Market share by geography 2022-2027 (%) Exhibit 70: Data Table on Market share by geography 2022-2027 (%)
9.2 Geographic comparison
Exhibit 71: Chart on Geographic comparison Exhibit 72: Data Table on Geographic comparison
9.3 APAC - Market size and forecast 2022-2027 Exhibit 73: Chart on APAC - Market size and forecast 2022-2027 ($ million) Exhibit 74: Data Table on APAC - Market size and forecast 2022-2027 ($ million) Exhibit 75: Chart on APAC - Year-over-year growth 2022-2027 (%) Exhibit 76: Data Table on APAC - Year-over-year growth 2022-2027 (%)
9.4 Europe - Market size and forecast 2022-2027 Exhibit 77: Chart on Europe - Market size and forecast 2022-2027 ($ million) Exhibit 78: Data Table on Europe - Market size and forecast 2022-2027 ($ million) Exhibit 79: Chart on Europe - Year-over-year growth 2022-2027 (%) Exhibit 80: Data Table on Europe - Year-over-year growth 2022-2027 (%)
9.5 North America - Market size and forecast 2022-2027 Exhibit 81: Chart on North America - Market size and forecast 2022-2027 ($ million) Exhibit 82: Data Table on North America - Market size and forecast 2022-2027 ($ million) Exhibit 83: Chart on North America - Year-over-year growth 2022-2027 (%) Exhibit 84: Data Table on North America - Year-over-year growth 2022-2027 (%)
9.6 Middle East and Africa - Market size and forecast 2022-2027
Exhibit 85: Chart on Middle East and Africa - Market size and forecast 2022-2027 ($ million) Exhibit 86: Data Table on Middle East and Africa - Market size and forecast 2022-2027 ($ million) Exhibit 87: Chart on Middle East and Africa - Year-over-year growth 2022-2027 (%) Exhibit 88: Data Table on Middle East and Africa - Year-over-year growth 2022-2027 (%)
9.7 South America - Market size and forecast 2022-2027 Exhibit 89: Chart on South America - Market size and forecast 2022-2027 ($ million) Exhibit 90: Data Table on South America - Market size and forecast 2022-2027 ($ million) Exhibit 91: Chart on South America - Year-over-year growth 2022-2027 (%) Exhibit 92: Data Table on South America - Year-over-year growth 2022-2027 (%)
9.8 China - Market size and forecast 2022-2027 Exhibit 93: Chart on China - Market size and forecast 2022-2027 ($ million) Exhibit 94: Data Table on China - Market size and forecast 2022-2027 ($ million) Exhibit 95: Chart on China - Year-over-year growth 2022-2027 (%) Exhibit 96: Data Table on China - Year-over-year growth 2022-2027 (%)
9.9 US - Market size and forecast 2022-2027 Exhibit 97: Chart on US - Market size and forecast 2022-2027 ($ million) Exhibit 98: Data Table on US - Market size and forecast 2022-2027 ($ million) Exhibit 99: Chart on US - Year-over-year growth 2022-2027 (%) Exhibit 100: Data Table on US - Year-over-year growth 2022-2027 (%)
9.10 Japan - Market size and forecast 2022-2027 Exhibit 101: Chart on Japan - Market size and forecast 2022-2027 ($ million) Exhibit 102: Data Table on Japan - Market size and forecast 2022-2027 ($ million) Exhibit 103: Chart on Japan - Year-over-year growth 2022-2027 (%) Exhibit 104: Data Table on Japan - Year-over-year growth 2022-2027 (%)
9.11 Germany - Market size and forecast 2022-2027 Exhibit 105: Chart on Germany - Market size and forecast 2022-2027 ($ million) Exhibit 106: Data Table on Germany - Market size and forecast 2022-2027 ($ million) Exhibit 107: Chart on Germany - Year-over-year growth 2022-2027 (%) Exhibit 108: Data Table on Germany - Year-over-year growth 2022-2027 (%)
9.12 South Korea - Market size and forecast 2022-2027 Exhibit 109: Chart on South Korea - Market size and forecast 2022-2027 ($ million) Exhibit 110: Data Table on South Korea - Market size and forecast 2022-2027 ($ million) Exhibit 111: Chart on South Korea - Year-over-year growth 2022-2027 (%) Exhibit 112: Data Table on South Korea - Year-over-year growth 2022-2027 (%)
9.13 Market opportunity by geography
Exhibit 113: Market opportunity by geography ($ million)
10 Drivers, Challenges, and Trends
10.3 Impact of drivers and challenges
Exhibit 114: Impact of drivers and challenges in 2022 and 2027
11 Vendor Landscape
11.2 Vendor landscape
Exhibit 115: Overview on Criticality of inputs and Factors of differentiation
11.3 Landscape disruption
Exhibit 116: Overview on factors of disruption
11.4 Industry risks
Exhibit 117: Impact of key risks on business
12 Vendor Analysis
12.1 Vendors covered
Exhibit 118: Vendors covered
12.2 Market positioning of vendors
Exhibit 119: Matrix on vendor position and classification
12.3 Amphenol Corp.
Exhibit 120: Amphenol Corp. - Overview Exhibit 121: Amphenol Corp. - Business segments Exhibit 122: Amphenol Corp. - Key offerings Exhibit 123: Amphenol Corp. - Segment focus
12.4 Belden Inc.
Exhibit 124: Belden Inc. - Overview Exhibit 125: Belden Inc. - Business segments Exhibit 126: Belden Inc. - Key news Exhibit 127: Belden Inc. - Key offerings Exhibit 128: Belden Inc. - Segment focus
12.5 Coleman Wires and Cables
Exhibit 129: Coleman Wires and Cables - Overview Exhibit 130: Coleman Wires and Cables - Product / Service Exhibit 131: Coleman Wires and Cables - Key offerings
12.6 CommScope Holding Co. Inc.
Exhibit 132: CommScope Holding Co. Inc. - Overview Exhibit 133: CommScope Holding Co. Inc. - Business segments Exhibit 134: CommScope Holding Co. Inc. - Key news Exhibit 135: CommScope Holding Co. Inc. - Key offerings Exhibit 136: CommScope Holding Co. Inc. - Segment focus
12.7 Habia Cable AB
Exhibit 137: Habia Cable AB - Overview Exhibit 138: Habia Cable AB - Product / Service Exhibit 139: Habia Cable AB - Key news Exhibit 140: Habia Cable AB - Key offerings
12.8 Hengxin Technology Ltd.
Exhibit 141: Hengxin Technology Ltd. - Overview Exhibit 142: Hengxin Technology Ltd. - Business segments Exhibit 143: Hengxin Technology Ltd. - Key offerings Exhibit 144: Hengxin Technology Ltd. - Segment focus
12.9 HUBER SUHNER AG
Exhibit 145: HUBER SUHNER AG - Overview Exhibit 146: HUBER SUHNER AG - Business segments Exhibit 147: HUBER SUHNER AG - Key news Exhibit 148: HUBER SUHNER AG - Key offerings Exhibit 149: HUBER SUHNER AG - Segment focus
12.10 Infinite Electronics Inc.
Exhibit 150: Infinite Electronics Inc. - Overview Exhibit 151: Infinite Electronics Inc. - Product / Service Exhibit 152: Infinite Electronics Inc. - Key offerings
12.11 Infinite Electronics International Inc. Exhibit 153: Infinite Electronics International Inc. - Overview Exhibit 154: Infinite Electronics International Inc. - Product / Service Exhibit 155: Infinite Electronics International Inc. - Key offerings
12.12 Leoni AG
Exhibit 156: Leoni AG - Overview Exhibit 157: Leoni AG - Business segments Exhibit 158: Leoni AG - Key news Exhibit 159: Leoni AG - Key offerings Exhibit 160: Leoni AG - Segment focus
12.13 LS Cable and System Ltd.
Exhibit 161: LS Cable and System Ltd. - Overview Exhibit 162: LS Cable and System Ltd. - Product / Service Exhibit 163: LS Cable and System Ltd. - Key offerings
12.14 Prysmian Spa
Exhibit 164: Prysmian Spa - Overview Exhibit 165: Prysmian Spa - Business segments Exhibit 166: Prysmian Spa - Key offerings Exhibit 167: Prysmian Spa - Segment focus
12.15 Sumitomo Electric Industries Ltd.
Exhibit 168: Sumitomo Electric Industries Ltd. - Overview Exhibit 169: Sumitomo Electric Industries Ltd. - Business segments Exhibit 170: Sumitomo Electric Industries Ltd. - Key news Exhibit 171: Sumitomo Electric Industries Ltd. - Key offerings Exhibit 172: Sumitomo Electric Industries Ltd. - Segment focus
12.16 Trigiant Group Ltd.
Exhibit 173: Trigiant Group Ltd. - Overview Exhibit 174: Trigiant Group Ltd. - Product / Service Exhibit 175: Trigiant Group Ltd. - Key offerings
12.17 Zhuhai Hansen Technology Co. Ltd.
Exhibit 176: Zhuhai Hansen Technology Co. Ltd. - Overview Exhibit 177: Zhuhai Hansen Technology Co. Ltd. - Product / Service Exhibit 178: Zhuhai Hansen Technology Co. Ltd. - Key offerings
13 Appendix
13.2 Inclusions and exclusions checklist
Exhibit 179: Inclusions checklist Exhibit 180: Exclusions checklist
13.3 Currency conversion rates for US$
Exhibit 181: Currency conversion rates for US$
13.4 Research methodology
Exhibit 182: Research methodology Exhibit 183: Validation techniques employed for market sizing Exhibit 184: Information sources
13.5 List of abbreviations
Exhibit 185: List of abbreviations
About Us
Technavio is a leading global technology research and advisory company. Their research and analysis focuses on emerging market trends and provides actionable insights to help businesses identify market opportunities and develop effective strategies to optimize their market positions. With over 500 specialized analysts, Technavio's report library consists of more than 17,000 reports and counting, covering 800 technologies, spanning across 50 countries. Their client base consists of enterprises of all sizes, including more than 100 Fortune 500 companies. This growing client base relies on Technavio's comprehensive coverage, extensive research, and actionable market insights to identify opportunities in existing and potential markets and assess their competitive positions within changing market scenarios.
Contact
Technavio Research
Jesse Maida
Media & Marketing Executive
US: +1 844 364 1100
UK: +44 203 893 3200
Email: [email protected]
Website:
SOURCE Technavio