(MENAFN- PR Newswire)
NEW YORK , Sept. 26, 2022 /PRNewswire/ -- The lactose-free butter market is fragmented due to the presence of a large number of vendors. Vendors are deploying organic and inorganic growth strategies to compete in the market. Vendors compete on factors such as price, quality, marketing strategies, innovations, market expansion, and distribution networks. They adopt various growth strategies to expand their profits and market shares and stay competitive. The increasing demand for different flavors of lactose-free butter has widened the scope of growth for vendors across the world. In addition, product innovation has been a major competitive strategy in this market. Thus, the launch of innovative products in the market will intensify the competition in the global lactose-free butter market.
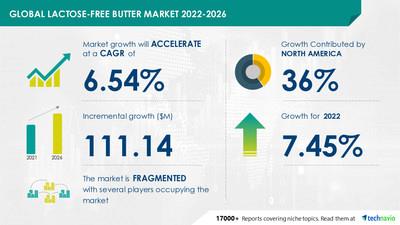
Technavio has announced its latest market research report titled Global Lactose-Free Butter Market 2022-2026
The size is expected to grow by USD 111.14 million from 2021 to 2026, according to Technavio. In addition, the growth momentum of the market will accelerate at a CAGR of 6.54% during the forecast period.
Use the analysis and insights provided by Technavio for effective decision-making.
The growing awareness about lactose-intolerant conditions is driving the growth of the lactose-free butter market. However, factors such as limited awareness and high prices may challenge the market growth during the forecast period.
Parent Market Analysis
Technavio categorizes the global lactose-free butter market as a part of the global packaged foods and meats market under the global food products segment of the global food, beverage, and tobacco market. The global packaged foods and meats products market covers manufacturers or food processing vendors that are involved in food processing to eliminate microorganisms and extend shelf life. The growth of this market is driven by factors such as health benefits associated with intake of minimally processed food, increasing demand for processed vegetables, strong distribution network, private label marketplace, increased offerings of packaged food under the halal category, the increasing popularity of superfruits, and rise in online sales. However, factors such as the threat from unorganized players and intense competition among vendors, lack of awareness of the difference between minimally and heavily processed vegetables, stringent food safety regulations, and increasing food allergy among consumers.
Major Lactose-Free Butter Companies
- Arla Foods amba
- California Dairies Inc.
- Cargill Inc.
- Chr Hansen Holding AS
- Conagra Brands Inc.
- Corbion NV
- General Mills Inc.
- Ingredion Inc.
- International Flavors and Fragrances Inc
- Johnson and Johnson
- Kellogg Co.
- Kerry Group Plc
- Miyokos Creamery
- Morrison Supermarkets Ltd.
- Redwood Hill Farm and Creamery Inc.
- The Hain Celestial Group Inc.
- Uelzena eG
- Upfield B.V
- Valio Ltd
Lactose-Free Butter Market Application Outlook (Revenue, USD mn, 2021-2026)
- Household - size and forecast 2021-2026
- Commercial - size and forecast 2021-2026
Lactose-Free Butter Market Geography Outlook (Revenue, USD mn, 2021-2026)
- North America - size and forecast 2021-2026
- Europe - size and forecast 2021-2026
- APAC - size and forecast 2021-2026
- South America - size and forecast 2021-2026
- Middle East and Africa - size and forecast 2021-2026
Learn about the contribution of each segment of the lactose-free butter market during the forecast period. The segment shares are summarized in concise infographics and thorough descriptions.
Related Reports
by Distribution Channel and Geography - Forecast and Analysis 2022-2026: The peanut butter market share is expected to increase by USD 1.35 billion from 2021 to 2026.
by Application and Geography - Forecast and Analysis 2022-2026: The mango butter market share is expected to increase by USD 47.83 million from 2021 to 2026.
| Lactose-Free Butter Market Scope |
| Report Coverage | Details |
| Page number | 120 |
| Base year | 2021 |
| Forecast period | 2022-2026 |
| Growth momentum & CAGR | Accelerate at a CAGR of 6.54% |
| Market growth 2022-2026 | USD 111.14 million |
| Market structure | Fragmented |
| YoY growth (%) | 7.45 |
| Regional analysis | North America, Europe, APAC, South America, and Middle East and Africa |
| Performing market contribution | North America at 36% |
| Key consumer countries | US, Canada, India, UK, and Germany |
| Competitive landscape | Leading companies, Competitive strategies, Consumer engagement scope |
| Key companies profiled | Arla Foods amba, California Dairies Inc., Cargill Inc., Chr Hansen Holding AS, Conagra Brands Inc., Corbion NV, General Mills Inc., Ingredion Inc., International Flavors and Fragrances Inc, Johnson and Johnson, Kellogg Co., Kerry Group Plc, Miyokos Creamery, Morrison Supermarkets Ltd., Redwood Hill Farm and Creamery Inc., The Hain Celestial Group Inc., Uelzena eG, Upfield B.V, and Valio Ltd |
| Market dynamics | Parent market analysis, market growth inducers and obstacles, fast-growing and slow-growing segment analysis, COVID-19 impact and recovery analysis and future consumer dynamics, and market condition analysis for the forecast period. |
| Customization purview | If our report has not included the data that you are looking for, you can reach out to our analysts and get segments customized. |
Browse Market Reports
Table of Contents
1 Executive Summary
- 1.1 Market overview
- Exhibit 01: Executive Summary – Chart on Market Overview
- Exhibit 02: Executive Summary – Data Table on Market Overview
- Exhibit 03: Executive Summary – Chart on Global Market Characteristics
- Exhibit 04: Executive Summary – Chart on Market by Geography
- Exhibit 05: Executive Summary – Chart on Market Segmentation by Application
- Exhibit 06: Executive Summary – Chart on Incremental Growth
- Exhibit 07: Executive Summary – Data Table on Incremental Growth
- Exhibit 08: Executive Summary – Chart on Vendor Market Positioning
2 Market Landscape
- 2.1 Market ecosystem
- Exhibit 09: Parent market
- Exhibit 10: Market Characteristics
3 Market Sizing
- 3.1 Market definition
- Exhibit 11: Offerings of vendors included in the market definition
- 3.2 Market segment analysis
- Exhibit 12: Market segments
- 3.4 Market outlook: Forecast for 2021-2026
- Exhibit 13: Chart on Global - Market size and forecast 2021-2026 ($ million)
- Exhibit 14: Data Table on Global - Market size and forecast 2021-2026 ($ million)
- Exhibit 15: Chart on Global Market: Year-over-year growth 2021-2026 (%)
- Exhibit 16: Data Table on Global Market: Year-over-year growth 2021-2026 (%)
4 Five Forces Analysis
- 4.1 Five forces summary
- Exhibit 17: Five forces analysis - Comparison between 2021 and 2026
- 4.2 Bargaining power of buyers
- Exhibit 18: Chart on Bargaining power of buyers – Impact of key factors 2021 and 2026
- 4.3 Bargaining power of suppliers
- Exhibit 19: Bargaining power of suppliers – Impact of key factors in 2021 and 2026
- 4.4 Threat of new entrants
- Exhibit 20: Threat of new entrants – Impact of key factors in 2021 and 2026
- 4.5 Threat of substitutes
- Exhibit 21: Threat of substitutes – Impact of key factors in 2021 and 2026
- 4.6 Threat of rivalry
- Exhibit 22: Threat of rivalry – Impact of key factors in 2021 and 2026
- 4.7 Market condition
- Exhibit 23: Chart on Market condition - Five forces 2021 and 2026
5 Market Segmentation by Application
- 5.1 Market segments
- Exhibit 24: Chart on Application - Market share 2021-2026 (%)
- Exhibit 25: Data Table on Application - Market share 2021-2026 (%)
- 5.2 Comparison by Application
- Exhibit 26: Chart on Comparison by Application
- Exhibit 27: Data Table on Comparison by Application
- 5.3 Household - Market size and forecast 2021-2026
- Exhibit 28: Chart on Household - Market size and forecast 2021-2026 ($ million)
- Exhibit 29: Data Table on Household - Market size and forecast 2021-2026 ($ million)
- Exhibit 30: Chart on Household - Year-over-year growth 2021-2026 (%)
- Exhibit 31: Data Table on Household - Year-over-year growth 2021-2026 (%)
- 5.4 Commercial - Market size and forecast 2021-2026
- Exhibit 32: Chart on Commercial - Market size and forecast 2021-2026 ($ million)
- Exhibit 33: Data Table on Commercial - Market size and forecast 2021-2026 ($ million)
- Exhibit 34: Chart on Commercial - Year-over-year growth 2021-2026 (%)
- Exhibit 35: Data Table on Commercial - Year-over-year growth 2021-2026 (%)
- 5.5 Market opportunity by Application
- Exhibit 36: Market opportunity by Application ($ million)
6 Customer Landscape
- 6.1 Customer landscape overview
- Exhibit 37: Analysis of price sensitivity, lifecycle, customer purchase basket, adoption rates, and purchase criteria
7 Geographic Landscape
- 7.1 Geographic segmentation
- Exhibit 38: Chart on Market share by geography 2021-2026 (%)
- Exhibit 39: Data Table on Market share by geography 2021-2026 (%)
- 7.2 Geographic comparison
- Exhibit 40: Chart on Geographic comparison
- Exhibit 41: Data Table on Geographic comparison
- 7.3 North America - Market size and forecast 2021-2026
- Exhibit 42: Chart on North America - Market size and forecast 2021-2026 ($ million)
- Exhibit 43: Data Table on North America - Market size and forecast 2021-2026 ($ million)
- Exhibit 44: Chart on North America - Year-over-year growth 2021-2026 (%)
- Exhibit 45: Data Table on North America - Year-over-year growth 2021-2026 (%)
- 7.4 Europe - Market size and forecast 2021-2026
- Exhibit 46: Chart on Europe - Market size and forecast 2021-2026 ($ million)
- Exhibit 47: Data Table on Europe - Market size and forecast 2021-2026 ($ million)
- Exhibit 48: Chart on Europe - Year-over-year growth 2021-2026 (%)
- Exhibit 49: Data Table on Europe - Year-over-year growth 2021-2026 (%)
- 7.5 APAC - Market size and forecast 2021-2026
- Exhibit 50: Chart on APAC - Market size and forecast 2021-2026 ($ million)
- Exhibit 51: Data Table on APAC - Market size and forecast 2021-2026 ($ million)
- Exhibit 52: Chart on APAC - Year-over-year growth 2021-2026 (%)
- Exhibit 53: Data Table on APAC - Year-over-year growth 2021-2026 (%)
- 7.6 South America - Market size and forecast 2021-2026
- Exhibit 54: Chart on South America - Market size and forecast 2021-2026 ($ million)
- Exhibit 55: Data Table on South America - Market size and forecast 2021-2026 ($ million)
- Exhibit 56: Chart on South America - Year-over-year growth 2021-2026 (%)
- Exhibit 57: Data Table on South America - Year-over-year growth 2021-2026 (%)
- 7.7 Middle East and Africa - Market size and forecast 2021-2026
- Exhibit 58: Chart on Middle East and Africa - Market size and forecast 2021-2026 ($ million)
- Exhibit 59: Data Table on Middle East and Africa - Market size and forecast 2021-2026 ($ million)
- Exhibit 60: Chart on Middle East and Africa - Year-over-year growth 2021-2026 (%)
- Exhibit 61: Data Table on Middle East and Africa - Year-over-year growth 2021-2026 (%)
- 7.8 US - Market size and forecast 2021-2026
- Exhibit 62: Chart on US - Market size and forecast 2021-2026 ($ million)
- Exhibit 63: Data Table on US - Market size and forecast 2021-2026 ($ million)
- Exhibit 64: Chart on US - Year-over-year growth 2021-2026 (%)
- Exhibit 65: Data Table on US - Year-over-year growth 2021-2026 (%)
- 7.9 UK - Market size and forecast 2021-2026
- Exhibit 66: Chart on UK - Market size and forecast 2021-2026 ($ million)
- Exhibit 67: Data Table on UK - Market size and forecast 2021-2026 ($ million)
- Exhibit 68: Chart on UK - Year-over-year growth 2021-2026 (%)
- Exhibit 69: Data Table on UK - Year-over-year growth 2021-2026 (%)
- 7.10 Germany - Market size and forecast 2021-2026
- Exhibit 70: Chart on Germany - Market size and forecast 2021-2026 ($ million)
- Exhibit 71: Data Table on Germany - Market size and forecast 2021-2026 ($ million)
- Exhibit 72: Chart on Germany - Year-over-year growth 2021-2026 (%)
- Exhibit 73: Data Table on Germany - Year-over-year growth 2021-2026 (%)
- 7.11 Canada - Market size and forecast 2021-2026
- Exhibit 74: Chart on Canada - Market size and forecast 2021-2026 ($ million)
- Exhibit 75: Data Table on Canada - Market size and forecast 2021-2026 ($ million)
- Exhibit 76: Chart on Canada - Year-over-year growth 2021-2026 (%)
- Exhibit 77: Data Table on Canada - Year-over-year growth 2021-2026 (%)
- 7.12 India - Market size and forecast 2021-2026
- Exhibit 78: Chart on India - Market size and forecast 2021-2026 ($ million)
- Exhibit 79: Data Table on India - Market size and forecast 2021-2026 ($ million)
- Exhibit 80: Chart on India - Year-over-year growth 2021-2026 (%)
- Exhibit 81: Data Table on India - Year-over-year growth 2021-2026 (%)
- 7.13 Market opportunity by geography
- Exhibit 82: Market opportunity by geography ($ million)
8 Drivers, Challenges, and Trends
- 8.3 Impact of drivers and challenges
- Exhibit 83: Impact of drivers and challenges in 2021 and 2026
9 Vendor Landscape
- 9.2 Vendor landscape
- Exhibit 84: Overview on Criticality of inputs and Factors of differentiation
- 9.3 Landscape disruption
- Exhibit 85: Overview on factors of disruption
- 9.4 Industry risks
- Exhibit 86: Impact of key risks on business
10 Vendor Analysis
- 10.1 Vendors covered
- Exhibit 87: Vendors covered
- 10.2 Market positioning of vendors
- Exhibit 88: Matrix on vendor position and classification
- 10.3 Arla Foods amba
- Exhibit 89: Arla Foods amba - Overview
- Exhibit 90: Arla Foods amba - Product / Service
- Exhibit 91: Arla Foods amba - Key offerings
- 10.4 Cargill Inc.
- Exhibit 92: Cargill Inc. - Overview
- Exhibit 93: Cargill Inc. - Product / Service
- Exhibit 94: Cargill Inc. - Key news
- Exhibit 95: Cargill Inc. - Key offerings
- 10.5 Chr Hansen Holding AS
- Exhibit 96: Chr Hansen Holding AS - Overview
- Exhibit 97: Chr Hansen Holding AS - Business segments
- Exhibit 98: Chr Hansen Holding AS - Key news
- Exhibit 99: Chr Hansen Holding AS - Key offerings
- Exhibit 100: Chr Hansen Holding AS - Segment focus
- 10.6 Corbion NV
- Exhibit 101: Corbion NV - Overview
- Exhibit 102: Corbion NV - Business segments
- Exhibit 103: Corbion NV - Key news
- Exhibit 104: Corbion NV - Key offerings
- Exhibit 105: Corbion NV - Segment focus
- 10.7 General Mills Inc.
- Exhibit 106: General Mills Inc. - Overview
- Exhibit 107: General Mills Inc. - Business segments
- Exhibit 108: General Mills Inc. - Key news
- Exhibit 109: General Mills Inc. - Key offerings
- Exhibit 110: General Mills Inc. - Segment focus
- 10.8 Ingredion Inc.
- Exhibit 111: Ingredion Inc. - Overview
- Exhibit 112: Ingredion Inc. - Business segments
- Exhibit 113: Ingredion Inc. - Key news
- Exhibit 114: Ingredion Inc. - Key offerings
- Exhibit 115: Ingredion Inc. - Segment focus
- 10.9 International Flavors and Fragrances Inc
- Exhibit 116: International Flavors and Fragrances Inc - Overview
- Exhibit 117: International Flavors and Fragrances Inc - Business segments
- Exhibit 118: International Flavors and Fragrances Inc - Key news
- Exhibit 119: International Flavors and Fragrances Inc - Key offerings
- Exhibit 120: International Flavors and Fragrances Inc - Segment focus
- 10.10 Kellogg Co.
- Exhibit 121: Kellogg Co. - Overview
- Exhibit 122: Kellogg Co. - Business segments
- Exhibit 123: Kellogg Co. - Key news
- Exhibit 124: Kellogg Co. - Key offerings
- Exhibit 125: Kellogg Co. - Segment focus
- 10.11 Kerry Group Plc
- Exhibit 126: Kerry Group Plc - Overview
- Exhibit 127: Kerry Group Plc - Business segments
- Exhibit 128: Kerry Group Plc - Key offerings
- Exhibit 129: Kerry Group Plc - Segment focus
- 10.12 The Hain Celestial Group Inc.
- Exhibit 130: The Hain Celestial Group Inc. - Overview
- Exhibit 131: The Hain Celestial Group Inc. - Business segments
- Exhibit 132: The Hain Celestial Group Inc. - Key news
- Exhibit 133: The Hain Celestial Group Inc. - Key offerings
- Exhibit 134: The Hain Celestial Group Inc. - Segment focus
11 Appendix
- 11.2 Inclusions and exclusions checklist
- Exhibit 135: Inclusions checklist
- Exhibit 136: Exclusions checklist
- 11.3 Currency conversion rates for US$
- Exhibit 137: Currency conversion rates for US$
- 11.4 Research methodology
- Exhibit 138: Research methodology
- Exhibit 139: Validation techniques employed for market sizing
- Exhibit 140: Information sources
- 11.5 List of abbreviations
- Exhibit 141: List of abbreviations
About Technavio
Technavio is a leading global technology research and advisory company. Their research and analysis focus on emerging market trends and provide actionable insights to help businesses identify market opportunities and develop effective strategies to optimize their market positions.
With over 500 specialized analysts, Technavio's report library consists of more than 17,000 reports and counting, covering 800 technologies, spanning across 50 countries. Their client base consists of enterprises of all sizes, including more than 100 Fortune 500 companies. This growing client base relies on Technavio's comprehensive coverage, extensive research, and actionable market insights to identify opportunities in existing and potential markets and assess their competitive positions within changing market scenarios.
Contacts
Technavio ResearchJesse MaidaMedia & Marketing ExecutiveUS: +1 844 364 1100UK: +44 203 893 3200Email: Website:
SOURCE Technavio
MENAFN26092022003732001241ID1104928957
Legal Disclaimer:
MENAFN provides the information “as is” without warranty of any kind. We do not accept any responsibility or liability for the accuracy, content, images, videos, licenses, completeness, legality, or reliability of the information contained in this article. If you have any complaints or copyright issues related to this article, kindly contact the provider above.