(MENAFN- PR Newswire)
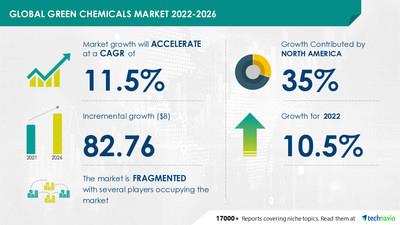
NEW YORK, Aug. 16, 2022 /PRNewswire/ -- According to the research report, the Green Chemicals Market will witness a YOY growth of 10.5% in 2022 at a CAGR of 11.5% during the forecast period. The report is segmented by product (bio alcohols, biopolymers, bio-organic acid, and bio-ketones) and geography (North America, Europe, APAC, South America, and the Middle East and Africa).
For more insights on YOY and CAGR, Read FREE Sample Report
Attractive Opportunities in Green Chemicals Market by Product and Geography - Forecast and Analysis 2022-2026
Vendor Insights
Global Green Chemicals Market is fragmented and the vendors are deploying various organic and inorganic growth strategies to compete in the market.
The growing competition in the market is compelling vendors to adopt various growth strategies such as promotional activities and spending on advertisements to improve the visibility of their services. Some vendors are also adopting inorganic growth strategies such as M&As to remain competitive in the market.
The report analyzes the market's competitive landscape and offers information on several market vendors, including:
- Arkema Group
- Balfour Beatty Plc
- BASF SE
- Bio Kleen
- Cargill Inc.
- Du Pont De Nemours Inc.
- Evonik Industries AG
- George Weston Foods Ltd.
- GFBiochemicals Ltd.
Find additional highlights on the growth strategies adopted by vendors and their product offerings, Buy Sample Report.
Geographical Market Analysis
North America will account for 35% of market growth . The main markets for green chemicals in North America are the US and Canada. The market in this region will expand more slowly than markets in other regions. Over the forecast period, the growth of the green chemicals market in North America would be aided by the rising demand for eco-friendly packaging.
Furthermore, countries such as the US, Canada, China, Germany, and the UK are expected to emerge as prominent markets for Green Chemicals Market during the forecast period. Download Free Sample Report .
Key Segment Analysis
The bio-alcohols category will significantly increase its market share in green chemicals. Bioalcohols are environmentally beneficial, sustainable organic compounds. They are frequently chosen as an alternative to gasoline for use in automobiles. A frequent substitute for gasoline is bioethanol, which is made from alcohol.
The most popular alcohol is bioethanol because of its higher yields and reduced operating costs. Additionally, rising crude oil prices and growing worries about greenhouse gas emissions are promoting the development of the bio alcohols market for global green chemicals.
Key Market Drivers & Challenges:
One of the main factors boosting the growth of the non-renewable resource market for green chemicals is its scarcity. In their most basic form, fossil fuels are valuable energy and feedstock sources. Nevertheless, because of their high prices, the depletion of fossil feedstock reserves, including those for natural gas, coal, and crude oil, has necessitated the search for alternate sources of energy and feedstocks for the chemical industry. Although factors such as lack of availability of raw materials may impede the market growth.
Related Reports:
Methyl Acetate Market by End-user and Geography - Forecast and Analysis 2022-2026 : The predicted growth for the methyl acetate market share from 2021 to 2026 is USD 9098.16 thousand at a progressing CAGR of 3.47%.
Silicon Nitride Market by Type and Geography - Forecast and Analysis 2022-2026 : The silicon nitride market share is expected to increase to USD 45.84 million from 2021 to 2026, and the market's growth momentum will accelerate at a CAGR of 7.12%.
| Green Chemicals Market Scope |
| Report Coverage | Details |
| Page number | 120 |
| Base year | 2021 |
| Forecast period | 2022-2026 |
| Growth momentum & CAGR | Accelerate at a CAGR of 11.5% |
| Market growth 2022-2026 | $ 82.76 billion |
| Market structure | Fragmented |
| YoY growth (%) | 10.5 |
| Regional analysis | North America, Europe, APAC, South America, Middle East, and Africa |
| Performing market contribution | North America at 35% |
| Key consumer countries | US, Canada, China, Germany, and the UK |
| Competitive landscape | Leading companies, Competitive Strategies, Consumer engagement scope |
| Key companies profiled | Arkema Group, Balfour Beatty Plc, BASF SE, Bio Kleen, Cargill Inc., Du Pont De Nemours Inc., Evonik Industries AG, George Weston Foods Ltd., GFBiochemicals Ltd., Givaudan, GREENCHEMICALS Spa, JSW Cement Ltd., Koninklijke DSM NV, Mitsubishi Chemical Holdings Corp., NatureWorks LLC, Novamont Spa, Governor, Plantic Technologies Ltd., Toray Industries Inc., TotalEnergies SE, and Vertec Biosolvents Inc. |
| Market dynamics | Parent market analysis, Market growth inducers and obstacles, Fast-growing and slow-growing segment analysis, COVID 19 impact and recovery analysis and future consumer dynamics, and Market condition analysis for the forecast period. |
| Customization purview | If our report has not included the data that you are looking for, you can reach out to our analysts and get segments customized. |
Browse for Technavio ' Materials ' Research Reports
Table of Contents
1 Executive Summary
- 1.1 Market Overview
- Exhibit 01: Executive Summary – Chart on Market Overview
- Exhibit 02: Executive Summary – Data Table on Market Overview
- Exhibit 03: Executive Summary – Chart of Global Market Characteristics
- Exhibit 04: Executive Summary – Chart of Market by Geography
- Exhibit 05: Executive Summary – Chart on Market Segmentation by Product
- Exhibit 06: Executive Summary – Chart on Incremental Growth
- Exhibit 07: Executive Summary – Data Table on Incremental Growth
- Exhibit 08: Executive Summary – Chart on Vendor Market Positioning
2 Market Landscape
- 2.1 Market ecosystem
- Exhibit 09: Parent market
- Exhibit 10: Market Characteristics
3 Market Sizing
- 3.1 Market Definition
- Exhibit 11: Offerings of vendors included in the market definition
- 3.2 Market segment analysis
- Exhibit 12: Market segments
- 3.4 Market outlook: Forecast for 2021-2026
- Exhibit 13: Chart on Global - Market size and forecast 2021-2026 ($ billion)
- Exhibit 14: Data Table on Global - Market size and forecast 2021-2026 ($ billion)
- Exhibit 15: Chart on Global Market: Year-over-year growth 2021-2026 (%)
- Exhibit 16: Data Table on Global Market: Year-over-year growth 2021-2026 (%)
4 Five Forces Analysis
- 4.1 Five forces summary
- Exhibit 17: Five forces analysis - Comparison between 2021 and 2026
- 4.2 Bargaining power of buyers
- Exhibit 18: Chart on the Bargaining power of buyers – Impact of key factors 2021 and 2026
- 4.3 Bargaining power of suppliers
- Exhibit 19: Bargaining power of suppliers – Impact of key factors in 2021 and 2026
- 4.4 Threat of new entrants
- Exhibit 20: Threat of new entrants – Impact of key factors in 2021 and 2026
- 4.5 Threat of substitutes
- Exhibit 21: Threat of substitutes – Impact of key factors in 2021 and 2026
- 4.6 Threat of rivalry
- Exhibit 22: Threat of rivalry – Impact of key factors in 2021 and 2026
- 4.7 Market condition
- Exhibit 23: Chart of Market condition - Five forces 2021 and 2026
5 Market Segmentation by Product
- 5.1 Market segments
- Exhibit 24: Chart on Product - Market share 2021-2026 (%)
- Exhibit 25: Data Table on Product - Market share 2021-2026 (%)
- 5.2 Comparison by Product
- Exhibit 26: Chart on Comparison by Product
- Exhibit 27: Data Table on Comparison by Product
- 5.3 Bioalcohols - Market size and forecast 2021-2026
- Exhibit 28: Chart on Bioalcohols - Market size and forecast 2021-2026 ($ billion)
- Exhibit 29: Data Table on Bioalcohols - Market size and forecast 2021-2026 ($ billion)
- Exhibit 30: Chart on Bioalcohols - Year-over-year growth 2021-2026 (%)
- Exhibit 31: Data Table on Bioalcohols - Year-over-year growth 2021-2026 (%)
- 5.4 Biopolymers - Market size and forecast 2021-2026
- Exhibit 32: Chart on Biopolymers - Market size and forecast 2021-2026 ($ billion)
- Exhibit 33: Data Table on Biopolymers - Market size and forecast 2021-2026 ($ billion)
- Exhibit 34: Chart on Biopolymers - Year-over-year growth 2021-2026 (%)
- Exhibit 35: Data Table on Biopolymers - Year-over-year growth 2021-2026 (%)
- 5.5 Bio-organic acids - Market size and forecast 2021-2026
- Exhibit 36: Chart on Bio-organic acids - Market size and forecast 2021-2026 ($ billion)
- Exhibit 37: Data Table on Bio-organic acids - Market size and forecast 2021-2026 ($ billion)
- Exhibit 38: Chart on Bio-organic acids - Year-over-year growth 2021-2026 (%)
- Exhibit 39: Data Table on Bio-organic acids - Year-over-year growth 2021-2026 (%)
- 5.6 Bio-ketones - Market size and forecast 2021-2026
- Exhibit 40: Chart on Bio-ketones - Market size and forecast 2021-2026 ($ billion)
- Exhibit 41: Data Table on Bio-ketones - Market size and forecast 2021-2026 ($ billion)
- Exhibit 42: Chart on Bio-ketones - Year-over-year growth 2021-2026 (%)
- Exhibit 43: Data Table on Bio-ketones - Year-over-year growth 2021-2026 (%)
- 5.7 Market opportunity by Product
- Exhibit 44: Market opportunity by Product ($ billion)
6 Customer Landscape
- 6.1 Customer landscape overview
- Exhibit 45: Analysis of price sensitivity, lifecycle, customer purchase basket, adoption rates, and purchase criteria
7 Geographic Landscape
- 7.1 Geographic segmentation
- Exhibit 46: Chart of Market share by geography 2021-2026 (%)
- Exhibit 47: Data Table on Market share by geography 2021-2026 (%)
- 7.2 Geographic comparison
- Exhibit 48: Chart of Geographic comparison
- Exhibit 49: Data Table on Geographic comparison
- 7.3 North America - Market size and forecast 2021-2026
- Exhibit 50: Chart on North America - Market size and forecast 2021-2026 ($ billion)
- Exhibit 51: Data Table on North America - Market size and forecast 2021-2026 ($ billion)
- Exhibit 52: Chart on North America - Year-over-year growth 2021-2026 (%)
- Exhibit 53: Data Table on North America - Year-over-year growth 2021-2026 (%)
- 7.4 Europe - Market size and forecast 2021-2026
- Exhibit 54: Chart on Europe - Market size and forecast 2021-2026 ($ billion)
- Exhibit 55: Data Table on Europe - Market size and forecast 2021-2026 ($ billion)
- Exhibit 56: Chart on Europe - Year-over-year growth 2021-2026 (%)
- Exhibit 57: Data Table on Europe - Year-over-year growth 2021-2026 (%)
- 7.5 APAC - Market size and forecast 2021-2026
- Exhibit 58: Chart on APAC - Market size and forecast 2021-2026 ($ billion)
- Exhibit 59: Data Table on APAC - Market size and forecast 2021-2026 ($ billion)
- Exhibit 60: Chart on APAC - Year-over-year growth 2021-2026 (%)
- Exhibit 61: Data Table on APAC - Year-over-year growth 2021-2026 (%)
- 7.6 South America - Market size and forecast 2021-2026
- Exhibit 62: Chart on South America - Market size and forecast 2021-2026 ($ billion)
- Exhibit 63: Data Table on South America - Market size and forecast 2021-2026 ($ billion)
- Exhibit 64: Chart on South America - Year-over-year growth 2021-2026 (%)
- Exhibit 65: Data Table on South America - Year-over-year growth 2021-2026 (%)
- 7.7 the Middle East and Africa - Market size and forecast 2021-2026
- Exhibit 66: Chart of the Middle East and Africa - Market size and forecast 2021-2026 ($ billion)
- Exhibit 67: Data Table on the Middle East and Africa - Market size and forecast 2021-2026 ($ billion)
- Exhibit 68: Chart on the Middle East and Africa - Year-over-year growth 2021-2026 (%)
- Exhibit 69: Data Table on the Middle East and Africa - Year-over-year growth 2021-2026 (%)
- 7.8 US - Market size and forecast 2021-2026
- Exhibit 70: Chart on the US - Market size and forecast 2021-2026 ($ billion)
- Exhibit 71: Data Table on the US - Market size and forecast 2021-2026 ($ billion)
- Exhibit 72: Chart on US - Year-over-year growth 2021-2026 (%)
- Exhibit 73: Data Table on the US - Year-over-year growth 2021-2026 (%)
- 7.9 China - Market size and forecast 2021-2026
- Exhibit 74: Chart on China - Market size and forecast 2021-2026 ($ billion)
- Exhibit 75: Data Table on China - Market size and forecast 2021-2026 ($ billion)
- Exhibit 76: Chart on China - Year-over-year growth 2021-2026 (%)
- Exhibit 77: Data Table on China - Year-over-year growth 2021-2026 (%)
- 7.10 Germany - Market size and forecast 2021-2026
- Exhibit 78: Chart on Germany - Market size and forecast 2021-2026 ($ billion)
- Exhibit 79: Data Table on Germany - Market size and forecast 2021-2026 ($ billion)
- Exhibit 80: Chart on Germany - Year-over-year growth 2021-2026 (%)
- Exhibit 81: Data Table on Germany - Year-over-year growth 2021-2026 (%)
- 7.11 UK - Market size and forecast 2021-2026
- Exhibit 82: Chart on the UK - Market size and forecast 2021-2026 ($ billion)
- Exhibit 83: Data Table on the UK - Market size and forecast 2021-2026 ($ billion)
- Exhibit 84: Chart on the UK - Year-over-year growth 2021-2026 (%)
- Exhibit 85: Data Table on the UK - Year-over-year growth 2021-2026 (%)
- 7.12 Canada - Market size and forecast 2021-2026
- Exhibit 86: Chart on Canada - Market size and forecast 2021-2026 ($ billion)
- Exhibit 87: Data Table on Canada - Market size and forecast 2021-2026 ($ billion)
- Exhibit 88: Chart on Canada - Year-over-year growth 2021-2026 (%)
- Exhibit 89: Data Table on Canada - Year-over-year growth 2021-2026 (%)
- 7.13 Market opportunity by geography
- Exhibit 90: Market opportunity by geography ($ billion)
8 Drivers, Challenges, and Trends
- 8.3 Impact of drivers and challenges
- Exhibit 91: Impact of drivers and challenges in 2021 and 2026
9 Vendor Landscape
- 9.2 Vendor landscape
- Exhibit 92: Overview of Criticality of inputs and Factors of differentiation
- 9.3 Landscape disruption
- Exhibit 93: Overview of factors of disruption
- 9.4 Industry risks
- Exhibit 94: Impact of key risks on business
10 Vendor Analysis
- 10.1 Vendors covered
- Exhibit 95: Vendors covered
- 10.2 Market positioning of vendors
- Exhibit 96: Matrix on vendor position and classification
- 10.3 Arkema Group
- Exhibit 97: Arkema Group - Overview
- Exhibit 98: Arkema Group - Business segments
- Exhibit 99: Arkema Group - Key news
- Exhibit 100: Arkema Group - Key offerings
- Exhibit 101: Arkema Group - Segment focus
- 10.4 BASF SE
- Exhibit 102: BASF SE - Overview
- Exhibit 103: BASF SE - Business segments
- Exhibit 104: BASF SE - Key news
- Exhibit 105: BASF SE - Key offerings
- Exhibit 106: BASF SE - Segment focus
- 10.5 Cargill Inc.
- Exhibit 107: Cargill Inc. - Overview
- Exhibit 108: Cargill Inc. - Product / Service
- Exhibit 109: Cargill Inc. - Key news
- Exhibit 110: Cargill Inc. - Key offerings
- 10.6 Du Pont De Nemours Inc.
- Exhibit 111: Du Pont De Nemours Inc. - Overview
- Exhibit 112: Du Pont De Nemours Inc. - Business segments
- Exhibit 113: Du Pont De Nemours Inc. - Key offerings
- Exhibit 114: Du Pont De Nemours Inc. - Segment focus
- 10.7 Evonik Industries AG
- Exhibit 115: Evonik Industries AG - Overview
- Exhibit 116: Evonik Industries AG - Business segments
- Exhibit 117: Evonik Industries AG - Key news
- Exhibit 118: Evonik Industries AG - Key offerings
- Exhibit 119: Evonik Industries AG - Segment focus
- 10.8 GREENCHEMICALS Spa
- Exhibit 120: GREEN CHEMICALS Spa - Overview
- Exhibit 121: GREEN CHEMICALS Spa - Product / Service
- Exhibit 122: GREEN CHEMICALS Spa - Key offerings
- 10.9 Koninklijke DSM NV
- Exhibit 123: Koninklijke DSM NV - Overview
- Exhibit 124: Koninklijke DSM NV - Business segments
- Exhibit 125: Koninklijke DSM NV - Key news
- Exhibit 126: Koninklijke DSM NV - Key offerings
- Exhibit 127: Koninklijke DSM NV - Segment focus
- 10.10 Mitsubishi Chemical Holdings Corp.
- Exhibit 128: Mitsubishi Chemical Holdings Corp. - Overview
- Exhibit 129: Mitsubishi Chemical Holdings Corp. - Business segments
- Exhibit 130: Mitsubishi Chemical Holdings Corp. - Key offerings
- Exhibit 131: Mitsubishi Chemical Holdings Corp. - Segment focus
- 10.11 Toray Industries Inc.
- Exhibit 132: Toray Industries Inc. - Overview
- Exhibit 133: Toray Industries Inc. - Business segments
- Exhibit 134: Toray Industries Inc. - Key news
- Exhibit 135: Toray Industries Inc. - Key offerings
- Exhibit 136: Toray Industries Inc. - Segment focus
- 10.12 TotalEnergies SE
- Exhibit 137: TotalEnergies SE - Overview
- Exhibit 138: TotalEnergies SE - Business segments
- Exhibit 139: TotalEnergies SE - Key news
- Exhibit 140: TotalEnergies SE - Key offerings
- Exhibit 141: TotalEnergies SE - Segment focus
11 Appendix
- 11.2 Inclusions and exclusions checklist
- Exhibit 142: Inclusions checklist
- Exhibit 143: Exclusions checklist
- 11.3 Currency conversion rates for US$
- Exhibit 144: Currency conversion rates for US$
- 11.4 Research methodology
- Exhibit 145: Research methodology
- Exhibit 146: Validation techniques employed for market sizing
- Exhibit 147: Information sources
- 11.5 List of abbreviations
- Exhibit 148: List of abbreviations
About Us: Technavio is a leading global technology research and advisory company.Their research and analysis focus on emerging market trends and provide actionable insights to help businesses identify market opportunities and develop effective strategies to optimize their market positions.With over 500 specialized analysts, Technavio's report library consists of more than 17,000 reports and counting, covering 800 technologies, spanning 50 countries.Their client base consists of enterprises of all sizes, including more than 100 Fortune 500 companies. This growing client base relies on Technavio's comprehensive coverage, extensive research, and actionable market insights to identify opportunities in existing and potential markets and assess their competitive positions within changing market scenarios.
Contact Technavio Research Jesse Maida Media & Marketing Executive US: +1 844 364 1100 UK: +44 203 893 3200 Email: [email protected] Website:
SOURCE Technavio
MENAFN16082022003732001241ID1104707421
Legal Disclaimer:
MENAFN provides the information “as is” without warranty of any kind. We do not accept any responsibility or liability for the accuracy, content, images, videos, licenses, completeness, legality, or reliability of the information contained in this article. If you have any complaints or copyright issues related to this article, kindly contact the provider above.